HTC 2007 Annual Report Download - page 98
Download and view the complete annual report
Please find page 98 of the 2007 HTC annual report below. You can navigate through the pages in the report by either clicking on the pages listed below, or by using the keyword search tool below to find specific information within the annual report.-
 1
1 -
2
-
3
-
4
-
5
-
6
-
7
-
8
-
9
-
10
-
11
-
12
-
13
-
14
-
15
-
16
-
17
-
18
-
19
-
20
-
21
-
22
-
23
-
24
-
25
-
26
-
27
-
28
-
29
-
30
-
31
-
32
-
33
-
34
-
35
-
36
-
37
-
38
-
39
-
40
-
41
-
42
-
43
-
44
-
45
-
46
-
47
-
48
-
49
-
50
-
51
-
52
-
53
-
54
-
55
-
56
-
57
-
58
-
59
-
60
-
61
-
62
-
63
-
64
-
65
-
66
-
67
-
68
-
69
-
70
-
71
-
72
-
73
-
74
-
75
-
76
-
77
-
78
-
79
-
80
-
81
-
82
-
83
-
84
-
85
-
86
-
87
-
 88
88 -
 89
89 -
 90
90 -
 91
91 -
 92
92 -
 93
93 -
 94
94 -
 95
95 -
 96
96 -
 97
97 -
 98
98 -
 99
99 -
 100
100 -
 101
101 -
 102
102 -
 103
103 -
 104
104 -
 105
105 -
 106
106 -
 107
107 -
 108
108 -
109
-
110
-
111
-
112
-
113
-
114
-
115
-
116
-
117
-
118
-
119
-
120
-
121
-
122
-
123
-
124
-
125
-
126
-
127
-
128
 |
 |

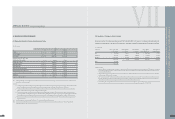
AN OVERVIEW OFTHE COMPANY'S FINANCIAL STATUS
191190
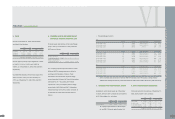
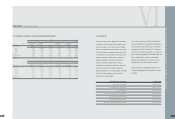
> Th
e
i
n
c
om
e
t
a
x
e
s
i
n 2005, 2006
a
nd 2007 w
e
r
e
a
s
f
o
ll
ows
:
2005 2006 2007
NT$ NT$ NT$ US$ (Note 3)
Current income tax $ 630,079 $ 1,849,052 $ 3,497,798 $ 107,857
Increase in deferred income tax assets ( 254,088) ( 172,381) ( 309,485) ( 9,543)
Underestimation of prior year's income tax 210 31,704 125,911 3,882
Income tax $ 376,201 $ 1,708,375 $ 3,314,224 $ 102,196
The integrated income tax information of HTC is as follows:
2005 2006 2007
NT$ NT$ NT$ US$ (Note 3)
Balance of imputation credit account $ 101,702 $ 481,742 $ 1,857,935 $ 57,291
Unappropriated earnings generated from 1998 14,152,255 31,991,090 41,403,867 1,276,715
Expected creditable ratio (including income tax payable) 5.08% 7.00% 10.56% 10.56%
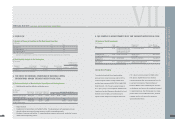
24. EARNINGS PER SHARE
Earnings per share (EPS) before tax and after tax are calculated by dividing net income by the weighted
average number of common shares outstanding, which includes the deduction of the effect of treasury stock
during each year. The weighted average number of shares used in EPS calculation was 573,414 thousand
shares in 2005; 577,919 thousand shares in 2006; and 573,299 thousand shares in 2007. The EPS in 2005 and
2006 were calculated after the average number of shares outstanding was adjusted retroactively for the effect of
stock dividend distribution in 2007.
VI
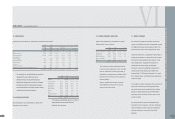
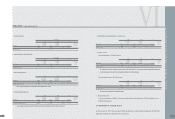
> D
e
t
a
il
s o
f
t
h
e
t
a
x
c
r
e
d
i
t
c
a
rry
f
orw
a
rds
a
r
e
a
s
f
o
ll
ows
:
2005 2006 2007
Credit Grant Year Validity Period NT$ NT$ NT$ US$ (Note 3)
Unrealized marketing expenses $ - $ 245,772 $ 757,691 $ 23,364
2002 2002-2006 $ 56,405 $ - $ - $ -
2003 2003-2007 58,500 - - -
2004 2004-2008 - - 6,965 215
2005 2005-2009 263,331 - 6,479 200
2006 2006-2010 - 9,574 15,475 477
2007 2007-2011 - - 18,565 572
$ 378,236 $ 9,574 $ 47,484 $ 1,464
> D
e
t
a
il
o
f
t
h
e
l
oss
c
a
rry
f
orw
a
rds
a
r
e
a
s
f
o
ll
ows
:
2005 2006 2007
Loss Year Validity Period NT$ NT$ NT$ US$ (Note 3)
2005 2006-2010 $ - $ - $ 95 $ 3
2006 2007-2011 - 31,474 50,703 1,564
2007 2008-2012 - - 50,372 1,553
$ - $ 31,474 $ 101,170 $ 3,120
Based on the Income Tax Act of the ROC, the investment research and development tax credits can be carried
forward for four years. The total credits used in each year cannot exceed half of the estimated income tax
provision, except in the last year.
Valuation allowance is based on management's evaluation of the amount of tax credits that can be carried
forward for four years, based on the Company's financial forecasts.
FINANCEI CONSOLIDATED REPORT
l