HTC 2007 Annual Report Download - page 107
Download and view the complete annual report
Please find page 107 of the 2007 HTC annual report below. You can navigate through the pages in the report by either clicking on the pages listed below, or by using the keyword search tool below to find specific information within the annual report.-
 1
1 -
2
-
3
-
4
-
5
-
6
-
7
-
8
-
9
-
10
-
11
-
12
-
13
-
14
-
15
-
16
-
17
-
18
-
19
-
20
-
21
-
22
-
23
-
24
-
25
-
26
-
27
-
28
-
29
-
30
-
31
-
32
-
33
-
34
-
35
-
36
-
37
-
38
-
39
-
40
-
41
-
42
-
43
-
44
-
45
-
46
-
47
-
48
-
49
-
50
-
51
-
52
-
53
-
54
-
55
-
56
-
57
-
58
-
59
-
60
-
61
-
62
-
63
-
64
-
65
-
66
-
67
-
68
-
69
-
70
-
71
-
72
-
73
-
74
-
75
-
76
-
77
-
78
-
79
-
80
-
81
-
82
-
83
-
84
-
85
-
86
-
87
-
88
-
89
-
90
-
91
-
92
-
93
-
94
-
95
-
96
-
 97
97 -
 98
98 -
 99
99 -
 100
100 -
 101
101 -
 102
102 -
 103
103 -
 104
104 -
 105
105 -
 106
106 -
 107
107 -
 108
108 -
 109
109 -
 110
110 -
 111
111 -
 112
112 -
 113
113 -
 114
114 -
 115
115 -
 116
116 -
 117
117 -
118
-
119
-
120
-
121
-
122
-
123
-
124
-
125
-
126
-
127
-
128
 |
 |

209208
A REVIEW AND ANALYSIS OFTHE COMPANY'S FINANCIAL CONDITION
AND OPERATING RESULTS,AND A LISTING OFRISKS
(2) An
a
l
ys
i
s o
f
Ch
a
ng
e
i
n Gross In
c
om
e
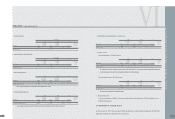
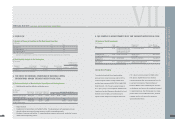
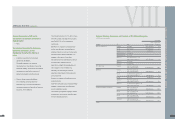
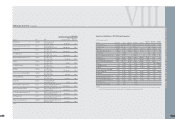
Gross income for the current period grew by NT$11,662,304,000, or 34 percent. Analyses and explanations of
variations in sales prices, cost prices, the sales mix, and sales volume for primary product lines are as follows:
U
nit :
N
T$ thousands
Product Type Variance of gross Profit Variance Owing to Variance Owing to Variance Owing to Variance Owing to
in 2007 and 2006 Price Difference Cost Difference Product Mix Difference Quantity Difference
PDA
( 1,192,598) 49,632 48,248 ( 1,347,990) 57,512
Smart Phone
1,126,101 744,985 400,401 ( 244,423) 225,138
PDA Phone
10,229,421 ( 797,346) 3,902,653 6,238,526 885,588
10,162,924 ( 2,729) 4,351,302 4,646,113 1,168,238
Others
1,499,380
11,662,304
Explanation of variances
1.
S
ales price variances: In the current period, due to the product
m
ix, sales prices for handheld co
m
puters were higher, and due to a lower proportion of
O
EM s
m
art phones, sales prices for
the non-
O
EM portion were so
m
ewhat higher, resulting in positive price variances. More price-based
m
arketing subsidies were granted for wireless handheld co
m
puters based on price,
resulting in a negative price variance.
2. Cost price variances: Aggressive control of
m
aterials costs and fixed
m
ass production cost allocation yielded lower per-unit costs for handheld co
m
puters, s
m
art phones, and wireless
handheld co
m
puters, resulting in positive cost variances.
3.
S
ales
m
ix variances: The period-on-period sales
m
ix variance for products other than wireless handheld co
m
puters was negative. This was pri
m
arily due to a significant increase in the
proportion of high gross-profit-
m
argin sales of wireless handheld co
m
puters, resulting in a corresponding drop in the proportions of other products. Thus the sales
m
ix variance for
wireless handheld co
m
puters was positive, but negative for other products, yielding an overall positive for sales
m
ix variance.
4. Volu
m
e variance: There was a slight increase in sales volu
m
e over the sa
m
e ti
m
e in the previous period. Extrapolation of a corresponding increase in sales volu
m
e based on the sales
m
ix
proportions fro
m
the previous period resulted in a positive volu
m
e variance. In su
mm
ary, gross inco
m
e for the current period increased by
N
T$11,662,304,000.
VII
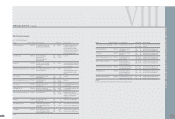
2. BUSINESS PER
F
ORMANCE
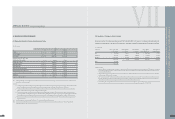
(1) Op
e
r
a
t
i
ng R
e
su
l
t
s
:
Comp
a
r
a
t
i
v
e
An
a
l
ys
i
s T
a
b
l
e
U
nit :
N
T$ thousands
Year
Item
2007 2006
Difference %
REVENUES
118,579,958 104,816,548 13,763,410 13
COST OF REVENUES
72,880,172 70,779,066 2,101,106 3
GROSS PROFIT
45,699,786 34,037,482 11,662,304 34
(UNREALIZED) REALIZED PROFIT FROM
INTERCOMPANY TRANSACTIONS
( 11,064) ( 148,934) 137,870 ( 93)
REALIZED GROSS PROFIT
45,688,722 33,888,548 11,800,174 35
OPERATING EXPENSES
14,665,297 7,336,582 7,328,715 100
OPERATING INCOME
31,023,425 26,551,966 4,471,459 17
NONOPERATING INCOME AND GAINS
1,810,908 1,234,336 576,572 47
NONOPERATING EXPENSES AND LOSSES
683,036 828,424 ( 145,388) ( 18)
Income from continuing operations before income tax
32,151,297 26,957,878 5,193,419 19
INCOME TAX
( 3,212,435) ( 1,710,551) ( 1,501,884) 88
Income from continuing operations
28,938,862 25,247,327 3,691,535 15
N
ote 1: Analysis and explanation of the percentage of increase/decrease for the
m
ost recent two fiscal years
(
when the change in gross inco
m
e is 20 percent or
m
ore, a separate discrepancy
analysis
(
Table 2
)
shall also be prepared
)
:
Explanation:
(
1
)
The period-on-period increase in operating revenue and operating expenses was due to serial launches of products with new functions, resulting in continuous growth in operating
revenue. The operating revenue growth rate was higher than the operating expenses growth rate due to an increase in the proportion of non-
O
EM business.
(
2
)
The period-on-period decrease in unrealized profits a
m
ong affiliated co
m
panies was pri
m
arily due to relatively stable inventory levels at subsidiaries during the current period,
relative to the larger changes of the previous period, resulting in lower unrealized profits.
(
3
)
The period-on-period increase in operating expenses was pri
m
arily due to a significant increase in allocations for after-sales service costs, expansion of sales locations and
personnel, and
m
arketing and advertising fees in response to own-brand and teleco
m
provider brand business growth. The rate of growth in net operating profit was slightly higher
than in operating revenue due to setting aside a portion of gross inco
m
e for invest
m
ent in quality upgrades for own-brand global operations,
m
arketing, and after-sales service.
(
4
)
The increase in non-operating revenue and profits was pri
m
arily due to an increase in ti
m
e deposits and interest inco
m
e; there were also increased foreign exchange gains due to
appreciation of the Euro.
N
ote 2:
R
eason for change of the co
m
pany
'
s principal line of business:
H
TC has not changed its principal line of business.
N
ote 3: The sales volu
m
e forecast for the co
m
ing fiscal year, its basis and potential i
m
pact on future co
m
pany finances and operations, and responsive
m
easures. Please refer to the
S
hareholders
'
R
eport for the sales volu
m
e forecast and its basis.
SPECIAL N OTESI BUSINESS PER
F
ORMANCE
l