HTC 2007 Annual Report Download - page 55
Download and view the complete annual report
Please find page 55 of the 2007 HTC annual report below. You can navigate through the pages in the report by either clicking on the pages listed below, or by using the keyword search tool below to find specific information within the annual report.-
 1
1 -
2
-
3
-
4
-
5
-
6
-
7
-
8
-
9
-
10
-
11
-
12
-
13
-
14
-
15
-
16
-
17
-
18
-
19
-
20
-
21
-
22
-
23
-
24
-
25
-
26
-
27
-
28
-
29
-
30
-
31
-
32
-
33
-
34
-
35
-
36
-
37
-
38
-
39
-
40
-
41
-
42
-
43
-
44
-
 45
45 -
 46
46 -
 47
47 -
 48
48 -
 49
49 -
 50
50 -
 51
51 -
 52
52 -
 53
53 -
 54
54 -
 55
55 -
 56
56 -
 57
57 -
 58
58 -
 59
59 -
 60
60 -
 61
61 -
 62
62 -
 63
63 -
 64
64 -
 65
65 -
66
-
67
-
68
-
69
-
70
-
71
-
72
-
73
-
74
-
75
-
76
-
77
-
78
-
79
-
80
-
81
-
82
-
83
-
84
-
85
-
86
-
87
-
88
-
89
-
90
-
91
-
92
-
93
-
94
-
95
-
96
-
97
-
98
-
99
-
100
-
101
-
102
-
103
-
104
-
105
-
106
-
107
-
108
-
109
-
110
-
111
-
112
-
113
-
114
-
115
-
116
-
117
-
118
-
119
-
120
-
121
-
122
-
123
-
124
-
125
-
126
-
127
-
128
 |
 |

105104
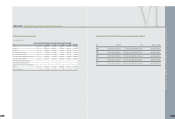
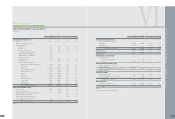
AN OVERVIEW OFTHE COMPANY'S FINANCIAL STATUS
VI
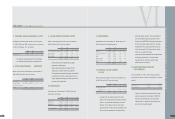
2005 2006 2007
Before After Before After Before After
Income Tax Income Tax Income Tax Income Tax Income Tax Income Tax
NT$ NT$ NT$ NT$ NT$ US$ (Note 3) NT$ US$(Note 3)
BASIC EARNINGS PER SHARE (Note 24) $ 21.20 $ 20.55 $ 46.65 $ 43.69 $ 56.08 $ 1.73 $ 50.48 $ 1.56
DILUTED EARNINGS PER SHARE (Note 24) $ 21.02 $ 20.37 $ 46.11 $ 43.18 $ 56.08 $ 1.73 $ 50.48 $ 1.56
(
Concluded
)
The acco
m
panying notes are an integral part of the financial state
m
ents.
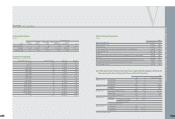
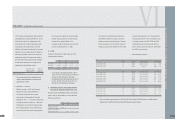
H I G H T E C H C O M P U T E R C O R P.
STATEMENTS O
F
INCOME
YEARS ENDED DECEMBER 31, 2005, 2006 AND 2007
(In Thousands, Except Earnings Per Share)
2005 2006 2007
NT$ NT$ NT$ US$ (Note 3)
REVENUES (Notes 2 and 26) $ 72,768,522 $ 104,816,548 $ 118,579,958 $ 3,656,490
COST OF REVENUES (Notes 22 and 26) 54,758,040 70,779,066 72,880,172 2,247,307
GROSS PROFIT 18,010,482 34,037,482 45,699,786 1,409,183
UNREALIZED PROFIT FROM INTERCOMPANY TRANSACTIONS (15,077) (164,011 ) (175,075 ) (5,399)
REALIZED PROFIT FROM INTERCOMPANY TRANSACTIONS 6,289 15,077 164,011 5,057
REALIZED GROSS PROFIT 18,001,694 33,888,548 45,688,722 1,408,841
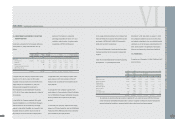
OPERATING EXPENSES (Notes 22 and 26)
Selling ad marketing 2,111,023 3,721,640 9,871,469 304,393
General and administrative 650,877 660,515 927,680 28,606
Research and development 2,399,315 2,954,427 3,866,148 119,215
Total operating expenses 5,161,215 7,336,582 14,665,297 452,214
OPERATING INCOME 12,840,479 26,551,966 31,023,425 956,627
NONOPERATING INCOME AND GAINS
Interest income 145,042 438,982 816,136 25,166
Gain on equity-method investments - - 103,997 3,207
Gain on sale of properties 5,372 41,361 2,120 65
Gain on physical inventory 2,074 - - -
Foreign exchange gain (Note 2) - 603,127 658,247 20,298
Valuation gain on financial assets (Notes 2, 4 and 6) 60,085 - - -
Other 65,487 150,866 230,408 7,105
Total nonoperating income and gains 278,060 1,234,336 1,810,908 55,841
NONOPERATING EXPENSES AND LOSSES
Interest expense 19,821 298 241 7
Losses on equity-method investments (Notes 2 and 14) 35,112 12,554 - -
Losses on disposal of properties 2,521 3,377 662 20
Loss on physical inventory - 2,032 409 13
Foreign exchange loss (Note 2) 299,005 - - -
Provision for loss on inventories 584,174 729,310 487,479 15,032
Valuation loss on financial liabilities (Notes 2, 4 and 6) - 76,470 96,256 2,968
Other 21,967 4,383 97,989 3,022
Total nonoperating expenses and losses 962,600 828,424 683,036 21,062
INCOME BEFORE INCOME TAX 12,155,939 26,957,878 32,151,297 991,406
INCOME TAX (Notes 2 and 23) (373,995) (1,710,551 ) (3,212,435 ) (99,058)
NET INCOME $ 11,781,944 $ 25,247,327 $ 28,938,862 $ 892,348
(
Continue
)