HTC 2007 Annual Report Download - page 83
Download and view the complete annual report
Please find page 83 of the 2007 HTC annual report below. You can navigate through the pages in the report by either clicking on the pages listed below, or by using the keyword search tool below to find specific information within the annual report.-
 1
1 -
2
-
3
-
4
-
5
-
6
-
7
-
8
-
9
-
10
-
11
-
12
-
13
-
14
-
15
-
16
-
17
-
18
-
19
-
20
-
21
-
22
-
23
-
24
-
25
-
26
-
27
-
28
-
29
-
30
-
31
-
32
-
33
-
34
-
35
-
36
-
37
-
38
-
39
-
40
-
41
-
42
-
43
-
44
-
45
-
46
-
47
-
48
-
49
-
50
-
51
-
52
-
53
-
54
-
55
-
56
-
57
-
58
-
59
-
60
-
61
-
62
-
63
-
64
-
65
-
66
-
67
-
68
-
69
-
70
-
71
-
72
-
 73
73 -
 74
74 -
 75
75 -
 76
76 -
 77
77 -
 78
78 -
 79
79 -
 80
80 -
 81
81 -
 82
82 -
 83
83 -
 84
84 -
 85
85 -
 86
86 -
 87
87 -
 88
88 -
 89
89 -
 90
90 -
 91
91 -
 92
92 -
 93
93 -
94
-
95
-
96
-
97
-
98
-
99
-
100
-
101
-
102
-
103
-
104
-
105
-
106
-
107
-
108
-
109
-
110
-
111
-
112
-
113
-
114
-
115
-
116
-
117
-
118
-
119
-
120
-
121
-
122
-
123
-
124
-
125
-
126
-
127
-
128
 |
 |

161160
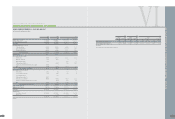
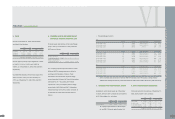
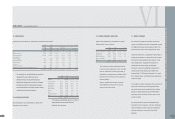
AN OVERVIEW OFTHE COMPANY'S FINANCIAL STATUS
VI
2005 2006 2007
NT$ NT$ NT$ US$ (Note 3)
CASH FLOWS FROM FINANCING ACTIVITIES
Decrease in long-term bank loans $ - $ - ($ 16,231) ($ 500)
(Decrease) increase in guarantee deposits received ( 272,517) 79 ( 7) -
Cash dividends ( 1,443,816) ( 4,998,224) ( 11,685,470) ( 360,329)
Bonus to employees ( 210,500) - ( 2,451,000) ( 75,578)
Purchase of treasury stock - ( 243,995) ( 1,747,760) ( 53,893)
Increase in minority interest - 161,499 - -
Net cash used in financing activities ( 1,926,833) ( 5,080,641) ( 15,900,468) ( 490,300)
EFFECT OF EXCHANGE RATE CHANGES ON
CASH AND CASH EQUIVALENTS 9,261 7,238 ( 13,230) ( 408)
NET INCREASE IN CASH AND CASH EQUIVALENTS $ 10,034,684 $ 18,544,592 $ 21,520,367 $ 663,594
CASH AND CASH EQUIVALENTS, BEGINNING OF YEAR 6,390,542 16,425,226 34,969,818 1,078,317
CASH AND CASH EQUIVALENTS, END OF YEAR $ 16,425,226 $ 34,969,818 $ 56,490,185 $ 1,741,911
SUPPLEMENTAL CASH FLOW INFORMATION
Cash paid during the year Interest $ - $ 298 $ 1,212 $ 37
Income tax $ 107,580 $ 738,902 $ 2,823,723 $ 87,071
NONCASH INVESTING AND FINANCING ACTIVITIES
Transfer of convertible bonds to common stock and additional paid-in capital $ 1,471,034 $ - $ - -
Transfer of retained earnings and employee bonuses to common stock $ 682,527 $ 794,032 $ 1,403,385 43,274
Retirement of treasury stock $ - $ - $ 1,991,755 61,417
PURCHASE OF PROPERTIES
Cost of properties purchased $ 635,592 $ 1,199,315 $ 1,553,653 $ 47,908
Decrease (increase) in payable for purchase of equipment 37,010 ( 29,013) ( 130,222) ( 4,015)
(Increase) decrease in lease payable - ( 3,894) 876 27
Cash paid for purchase of properties $ 672,602 $ 1,166,408 $ 1,424,307 $ 43,920
BONUS TO EMPLOYEES
Appropriation of bonus to employees $ 206,000 $ 451,000 $ 2,000,000 $ 61,671
Decrease (increase) in payable for employee bonus 4,500 ( 451,000) 451,000 13,907
Cash paid $ 210,500 $ - $ 2,451,000 $ 75,578
(Concluded)
The acco
m
panying notes are an integral part of the consolidated financial state
m
ents.
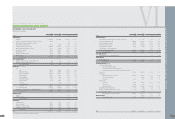
H I G H T E C H C O M P U T E R C O R P. A N D S U B S I D I A R I E S
CONSOLIDATED STATEMENTS O
F
CASH
F
LOWS
YEARS ENDED DECEMBER 31, 2005, 2006 AND 2007
(In Thousands)
2005 2006 2007
NT$ NT$ NT$ US$ (Note 3)
CASH FLOWS FROM OPERATING ACTIVITIES
Net income $ 11,781,944 $ 25,234,342 $ 28,917,712 $ 891,696
Adjustments to reconcile net income to net cash provided by operating activities
Depreciation 600,476 638,353 681,257 21,007
Amortization 44,098 40,516 51,862 1,599
(Gain) loss on disposal of properties, net ( 2,796) ( 35,699) 1,319 41
Provision for redemption of convertible bonds 2,042 - - -
Foreign exchange gains on convertible bonds ( 8,179) - - -
Amortization of bond issue costs 17,675 - - -
Deferred income tax assets ( 254,088) ( 172,381) ( 309,485) ( 9,543)
Prepaid pension cost ( 42,097) ( 24,260) ( 20,252) ( 624)
Net changes in operating assets and liabilities
Financial instruments at fair value through profit or loss ( 58,991) 136,555 19,257 594
Notes receivable ( 27,331) 40,157 55,398 1,708
Accounts receivable ( 5,942,099) ( 4,759,478) ( 285,922) ( 8,817)
Other current financial assets ( 24,306) ( 85,611) 83,900 2,587
Inventories ( 1,048,757) ( 645,482) ( 1,273,189) ( 39,260)
Prepayments ( 171,451) ( 1,449,856) 304,116 9,378
Other current assets 17,390 ( 192,527) ( 63,149) ( 1,947)
Notes and accounts payable 6,123,406 3,199,690 5,918,175 182,491
Income tax payable 522,709 1,141,854 799,986 24,668
Accrued expenses 371,546 1,241,816 2,636,439 81,296
Other current liabilities 743,836 459,756 2,280,787 70,330
Net cash provided by operating activities 12,645,027 24,767,745 39,798,211 1,227,204
CASH FLOWS FROM INVESTING ACTIVITIES
Purchase of properties ( 672,602) ( 1,166,408) ( 1,424,307) ( 43,920)
Proceeds of the sales of properties 5,918 44,701 6,552 202
Increase in restricted assets - - ( 34,500) ( 1,064)
Acquisition of financial assets carried at cost - - ( 500,000) ( 15,418)
Acquisition of bond investments with no active market - - ( 33,030) ( 1,019)
Acquisition of a subsidiary - - ( 240,039) ( 7,402)
Proceeds of the disposal of long-term investments 4,312 - - -
Increase in refundable deposits ( 29,922) ( 8,642) ( 86,803) ( 2,677)
Increase in deferred charges ( 477) ( 19,401) ( 52,019) ( 1,604)
Net cash used in investing activities ( 692,771) ( 1,149,750) ( 2,364,146) ( 72,902)
(Continue)