HTC 2007 Annual Report Download - page 22
Download and view the complete annual report
Please find page 22 of the 2007 HTC annual report below. You can navigate through the pages in the report by either clicking on the pages listed below, or by using the keyword search tool below to find specific information within the annual report.-
 1
1 -
2
-
3
-
4
-
5
-
6
-
7
-
8
-
9
-
10
-
11
-
 12
12 -
 13
13 -
 14
14 -
 15
15 -
 16
16 -
 17
17 -
 18
18 -
 19
19 -
 20
20 -
 21
21 -
 22
22 -
 23
23 -
 24
24 -
 25
25 -
 26
26 -
 27
27 -
 28
28 -
 29
29 -
 30
30 -
 31
31 -
 32
32 -
33
-
34
-
35
-
36
-
37
-
38
-
39
-
40
-
41
-
42
-
43
-
44
-
45
-
46
-
47
-
48
-
49
-
50
-
51
-
52
-
53
-
54
-
55
-
56
-
57
-
58
-
59
-
60
-
61
-
62
-
63
-
64
-
65
-
66
-
67
-
68
-
69
-
70
-
71
-
72
-
73
-
74
-
75
-
76
-
77
-
78
-
79
-
80
-
81
-
82
-
83
-
84
-
85
-
86
-
87
-
88
-
89
-
90
-
91
-
92
-
93
-
94
-
95
-
96
-
97
-
98
-
99
-
100
-
101
-
102
-
103
-
104
-
105
-
106
-
107
-
108
-
109
-
110
-
111
-
112
-
113
-
114
-
115
-
116
-
117
-
118
-
119
-
120
-
121
-
122
-
123
-
124
-
125
-
126
-
127
-
128
 |
 |

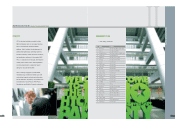
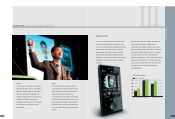
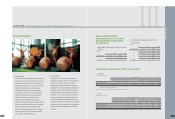
39
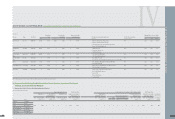
NT$11,364 (annualized) in 2007. This increase
again reinforces the value inherent in products sold
under the HTC brand.
Continued efforts to enhance HTC competitive
advantages fostered exceptional sales results in
2007, summarized in the graph below:
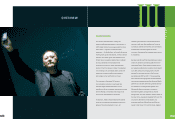
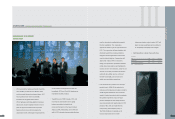
BRAND STRATEGIES
Strong brands build emotional attachments. They
attempt to develop a strong relationship between a
corporation and its consumers. For example, points
in time when a consumer first hears about HTC,
decides to learn more about HTC and its products,
chooses to purchase a product(s), and seeks after-
sales services are all part of the brand development
process, the ultimate goal of which is to secure long-
term consumer trust. Development of a successful
leading brand requires long-term investment and
effort, facilitated by changes in the industry and the
process of corporate globalization.
38
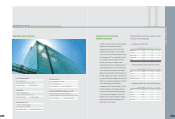
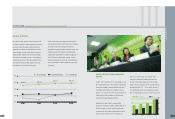
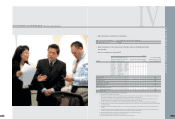
In 2007, one of HTC's key objectives was to
continue improving corporate operational efficiencies
and cost structures. Results are apparent by
comparing 2007 1st through 4th quarter gross
margins *2(adjusted) of, respectively, 33.0%, 33.7%,
34.1% and 34.6%. Affected by reduced ODM sales
and the increased importance of HTC's PDA phone
business, gross profit margins held a slight but
steady upward course. In support of the shift from
ODM manufacturing to producing products under the
HTC brand and those of HTC's telecommunications
service provider customers, the corporation has
specifically invested in innovative R&D, establishing
brand awareness, and actively building and
expanding global sales locations. HTC also
budgeted additional NT$1.25 billion for enhancing
after-sales service quality, representing 1.1% of
annual revenues. Therefore, the operating expense
ratio increased from 7.0% in 2006 to 12.4% in 2007.
Overall, HTC performance in 2007 was exceptional.
Net earnings after taxes of NT$28.9 billion in 2007
represented an increase of NT$3.7 billion over 2006.
HTC's net margin rose from 24.1% in 2006 to 24.4%
in 2007.
Success in transforming HTC's business model has
meant that most growth has been centered on sales
through telecommunications service provider and
HTC-branded channels. Average per unit sales
prices rose from NT$10,528 (annualized) in 2006 to
OVERVIEW
l
ANALYSIS O
F
2007 BUSINESS OPERATION RESULTS
l
BRAND STRATEGIES
l
III
2006 2007
9,500
10,000
10,500
11,000
11,500
Average Sales Price (Taiwan Dollar)Shipments (Thousand Units)
1 1 ,364
9,5 5 8
9,9 1 8
9,000
1 0 ,5 2 8
OVERVIEW
* 1:Please refer to the presentation slide of
"
EXEC
U
TIVE
S
U
MMA
R
Y
"
for 2007
Q
4
R
esults Conference on
H
TC website.
* 2:The gross
m
argins were adjusted by warranty services expenses and one-ti
m
e IP provision recovery. The calculation was different fro
m
consolidated profit
m
argin stated in
L
etter to
S
hareholders and gross
m
argin shown on audited financial reports. Please refer to the presentation slide of
"
Y07 P&
L
AFTE
R
W
A
RR
A
N
TY A
D
J
U
S
TME
N
T
"
for 2007
Q
4
R
esults Conference
on
H
TC website.