HTC 2007 Annual Report Download - page 72
Download and view the complete annual report
Please find page 72 of the 2007 HTC annual report below. You can navigate through the pages in the report by either clicking on the pages listed below, or by using the keyword search tool below to find specific information within the annual report.-
 1
1 -
2
-
3
-
4
-
5
-
6
-
7
-
8
-
9
-
10
-
11
-
12
-
13
-
14
-
15
-
16
-
17
-
18
-
19
-
20
-
21
-
22
-
23
-
24
-
25
-
26
-
27
-
28
-
29
-
30
-
31
-
32
-
33
-
34
-
35
-
36
-
37
-
38
-
39
-
40
-
41
-
42
-
43
-
44
-
45
-
46
-
47
-
48
-
49
-
50
-
51
-
52
-
53
-
54
-
55
-
56
-
57
-
58
-
59
-
60
-
61
-
 62
62 -
 63
63 -
 64
64 -
 65
65 -
 66
66 -
 67
67 -
 68
68 -
 69
69 -
 70
70 -
 71
71 -
 72
72 -
 73
73 -
 74
74 -
 75
75 -
 76
76 -
 77
77 -
 78
78 -
 79
79 -
 80
80 -
 81
81 -
 82
82 -
83
-
84
-
85
-
86
-
87
-
88
-
89
-
90
-
91
-
92
-
93
-
94
-
95
-
96
-
97
-
98
-
99
-
100
-
101
-
102
-
103
-
104
-
105
-
106
-
107
-
108
-
109
-
110
-
111
-
112
-
113
-
114
-
115
-
116
-
117
-
118
-
119
-
120
-
121
-
122
-
123
-
124
-
125
-
126
-
127
-
128
 |
 |

139138
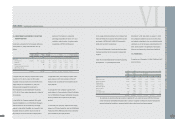
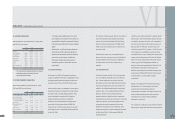
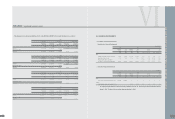
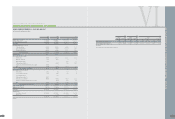
AN OVERVIEW OFTHE COMPANY'S FINANCIAL STATUS
25.
F
INANCIAL INSTRUMENTS
>
Fa
i
r V
a
l
u
e
o
f
F
i
n
a
n
c
i
a
l
Ins
t
rum
e
n
t
s
Nond
e
r
i
v
a
t
i
v
e
F
i
n
a
n
c
i
a
l
Ins
t
rum
e
n
t
s
December 31
2005 2006 2007
Carrying Fair Carrying Fair Carrying Fair
Amount Value Amount Value Amount Value
NT$ NT$ NT$ NT$ NT$ US$(Note 3) NT$ US$(Note 3)
Assets
Available-for-sale financial assets - noncurrent $ 836 $ 836 $ 1,733 $ 1,733 $ 784 $ 24 $ 784 $ 24
Financial assets carried at cost 1,192 1,192 1,192 1,192 501,192 15,455 501,192 15,455
Bond investments with no active market - - - - 33,030 1,019 33,030 1,019
Investments accounted for using equity method 323,505 323,505 821,556 821,556 2,397,133 73,917 2,397,133 73,917
> D
e
r
i
v
a
t
i
v
e
F
i
n
a
n
c
i
a
l
Ins
t
rum
e
n
t
s
December 31
2005 2006 2007
Carrying Fair Carrying Fair Carrying Fair
Amount Value Amount Value Amount Value
NT$ NT$ NT$ NT$ NT$ US$(Note 3) NT$ US$(Note 3)
Assets
Financial assets at fair value through profit or loss $ 60,085 $ 60,085 $ - $ - $ - $ - $ - $ -
Liabilities
Financial liabilities at fair value through profit or loss - - 76,470 76,470 96,256 2,968 96,256 2,968
•The Co
m
pany adopted
S
tate
m
ent of Financial Accounting
S
tandards
(
S
FA
S
)
N
o. 34 -
"
Accounting for Financial Instru
m
ents
"
effective
January 1, 2006. The effects of this accounting change are described in
N
ote 4.
VI
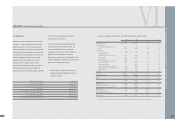
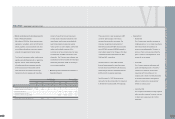
> Th
e
e
mp
l
oy
ee
s
t
o
ck
op
t
i
ons h
a
d d
il
u
t
i
v
e
e
ff
e
c
t
s on
t
h
e
2005
a
nd 2006 EPS. Th
e
r
e
l
a
t
e
d
i
n
f
orm
a
t
i
on
i
s
a
s
f
o
ll
ows
:
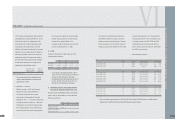
2005
Numerators Denominator EPS (In Dollars)
Income before Income after Shares Income before Income after
Income Tax Income Tax (Thousands) Income Tax Income Tax
NT$ NT$ NT$ NT$
Basic EPS $ 12,155,939 $ 11,781,944 573,414 $ 21.20 $ 20.55
Employee stock options - - 4,846
Diluted EPS $ 12,155,939 $ 11,781,944 578,260 $ 21.02 $ 20.37
2006
Numerators Denominator EPS (In Dollars)
Income before Income after Shares Income before Income after
Income Tax Income Tax (Thousands) Income Tax Income Tax
NT$ NT$ NT$ NT$
Basic EPS $ 26,957,878 $ 25,247,327 577,919 $ 46.65 $ 43.69
Employee stock options - - 6,763
Diluted EPS $ 26,957,878 $ 25,247,327 584,682 $ 46.11 $ 43.18
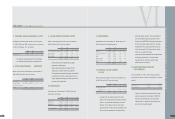
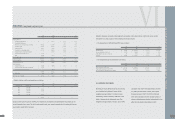
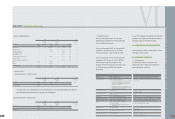
2007
Numerators Denominator EPS (In Dollars)
Income before Income after Shares Income before Income after
Income Tax Income Tax (Thousands) Income Tax Income Tax
NT$ NT$ NT$ NT$
Basic EPS $ 32,151,297 $ 28,938,862 573,299 $ 56.08 $ 50.48
Employee stock options - - -
Diluted EPS $ 32,151,297 $ 28,938,862 573,299 $ 56.08 $ 50.48
2007
Numerators Denominator EPS (In Dollars)
Income before Income after Shares Income before Income after
Income Tax Income Tax (Thousands) Income Tax Income Tax
US$ (Note 3) US$ (Note 3) US$ (Note 3) US$ (Note 3)
Basic EPS $ 991,406 $ 892,348 573,299 $ 1.73 $ 1.56
Employee stock options - - -
Diluted EPS $ 991,406 $ 892,348 573,299 $ 1.73 $ 1.56
FINANCEI INDEPENDENT AUDITORS' REPORT
l