HTC 2007 Annual Report Download - page 50
Download and view the complete annual report
Please find page 50 of the 2007 HTC annual report below. You can navigate through the pages in the report by either clicking on the pages listed below, or by using the keyword search tool below to find specific information within the annual report.-
 1
1 -
2
-
3
-
4
-
5
-
6
-
7
-
8
-
9
-
10
-
11
-
12
-
13
-
14
-
15
-
16
-
17
-
18
-
19
-
20
-
21
-
22
-
23
-
24
-
25
-
26
-
27
-
28
-
29
-
30
-
31
-
32
-
33
-
34
-
35
-
36
-
37
-
38
-
39
-
 40
40 -
 41
41 -
 42
42 -
 43
43 -
 44
44 -
 45
45 -
 46
46 -
 47
47 -
 48
48 -
 49
49 -
 50
50 -
 51
51 -
 52
52 -
 53
53 -
 54
54 -
 55
55 -
 56
56 -
 57
57 -
 58
58 -
 59
59 -
 60
60 -
61
-
62
-
63
-
64
-
65
-
66
-
67
-
68
-
69
-
70
-
71
-
72
-
73
-
74
-
75
-
76
-
77
-
78
-
79
-
80
-
81
-
82
-
83
-
84
-
85
-
86
-
87
-
88
-
89
-
90
-
91
-
92
-
93
-
94
-
95
-
96
-
97
-
98
-
99
-
100
-
101
-
102
-
103
-
104
-
105
-
106
-
107
-
108
-
109
-
110
-
111
-
112
-
113
-
114
-
115
-
116
-
117
-
118
-
119
-
120
-
121
-
122
-
123
-
124
-
125
-
126
-
127
-
128
 |
 |

9594
V I
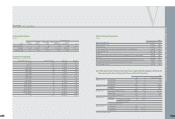
AN OVERVIEW OFTHE COMPANY'S FINANCIAL STATUS
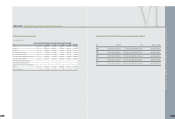
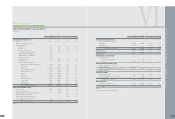
1. ABBREVIATED BALANCE SHEETS AND INCOME STATEMENTS
F
OR THE PAST
F
IVE
F
ISCAL YEARS
(1) Abbr
e
v
i
a
t
e
d B
a
l
a
n
c
e
Sh
ee
t
s
U
nit :
N
T$ thousands
Year
Item
2007 2006 2005 2004 2003 2008.03.31
current assets
83,172,719 61,810,772 36,616,174 19,391,836 13,118,636 90,229,639
long-term investments
2,899,109 824,481 325,533 352,000 111,187 2,581,512
Properties(Note2)
3,715,901 2,909,624 2,495,256 2,518,942 2,234,005 3,695,613
Intangible assets
-- - - - -
other assets
656,817 449,300 484,309 278,298 398,343 651,996
Total assets
90,444,546 65,994,177 39,921,272 22,541,076 15,862,171 97,158,760
Current Liabilities Before appropriation
34,368,139 23,421,319 16,935,170 9,421,405 8,184,249 34,226,421
After appropriation
*37,106,789 22,384,394 11,071,221 8,923,943
*
Long-term liabilities
-- - 1,477,171 - -
other liabilities
628 640 561 273,078 32,174 628
Total liabilities Before appropriation
34,368,767 23,421,959 16,935,731 11,171,654 8,216,423 34,227,049
After appropriation
*37,107,429 22,384,955 12,821,470 8,956,117
*
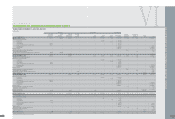
Capital stock
5,731,337 4,364,192 3,570,160 2,763,114 2,171,640 5,731,337
Capital surplus
4,415,845 4,452,688 4,436,843 3,090,328 2,529,667 4,415,845
Retained earnings Before appropriation
45,920,120 33,988,785 14,984,714 5,535,113 2,946,424 52,864,703
After appropriation
*18,899,930 8,741,458 3,202,770 1,679,767
*
Unrealized loss on financial instruments
( 1,187) ( 238) ( 1,135) ( 1,268) ( 277) ( 1,240)
Cumulative translation adjustments
9,664 10,786 ( 5,041) ( 17,865) ( 1,706) ( 78,934)
Net loss not recognized as pension cost
-- - - - -
Treasury stock
-( 243,995) - - - -
Total stockholders' equity Before appropriation
56,075,779 42,572,218 22,985,541 11,369,422 9,664 62,931,711
After appropriation
*28,886,748 17,536,317 9,719,606 6,906,054
*
*
S
ubject to change after shareholders
'
m
eeting resolution
A N O V ERVIEW
OF THE C O M PA N Y'S FIN A N C IAL STATUS