HTC 2007 Annual Report Download - page 71
Download and view the complete annual report
Please find page 71 of the 2007 HTC annual report below. You can navigate through the pages in the report by either clicking on the pages listed below, or by using the keyword search tool below to find specific information within the annual report.-
 1
1 -
2
-
3
-
4
-
5
-
6
-
7
-
8
-
9
-
10
-
11
-
12
-
13
-
14
-
15
-
16
-
17
-
18
-
19
-
20
-
21
-
22
-
23
-
24
-
25
-
26
-
27
-
28
-
29
-
30
-
31
-
32
-
33
-
34
-
35
-
36
-
37
-
38
-
39
-
40
-
41
-
42
-
43
-
44
-
45
-
46
-
47
-
48
-
49
-
50
-
51
-
52
-
53
-
54
-
55
-
56
-
57
-
58
-
59
-
60
-
 61
61 -
 62
62 -
 63
63 -
 64
64 -
 65
65 -
 66
66 -
 67
67 -
 68
68 -
 69
69 -
 70
70 -
 71
71 -
 72
72 -
 73
73 -
 74
74 -
 75
75 -
 76
76 -
 77
77 -
 78
78 -
 79
79 -
 80
80 -
 81
81 -
82
-
83
-
84
-
85
-
86
-
87
-
88
-
89
-
90
-
91
-
92
-
93
-
94
-
95
-
96
-
97
-
98
-
99
-
100
-
101
-
102
-
103
-
104
-
105
-
106
-
107
-
108
-
109
-
110
-
111
-
112
-
113
-
114
-
115
-
116
-
117
-
118
-
119
-
120
-
121
-
122
-
123
-
124
-
125
-
126
-
127
-
128
 |
 |

137136
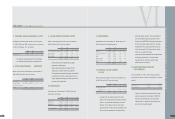
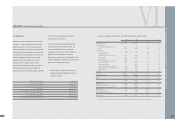
AN OVERVIEW OFTHE COMPANY'S FINANCIAL STATUS
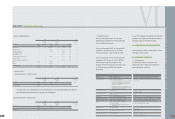
Valuation allowance is based on management's evaluation of the amount of tax credits that can be carried
forward for four years, based on the Company's financial forecasts.
> Th
e
i
n
c
om
e
t
a
x
e
s
i
n 2005, 2006
a
nd 2007 w
e
r
e
a
s
f
o
ll
ows
:
2005 2006 2007
NT$ NT$ NT$ US$(Note 3)
Current income tax $ 629,955 $ 1,847,294 $ 3,381,327 $ 104,265
Increase in deferred income tax assets ( 256,170) ( 168,447) ( 294,803) ( 9,090)
Underestimation of prior year s income tax 210 31,704 125,911 3,883
Income tax $ 373,995 $ 1,710,551 $ 3,212,435 $ 99,058
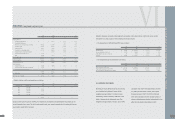
> Th
e
i
n
t
e
gr
a
t
e
d
i
n
c
om
e
t
a
x
i
n
f
orm
a
t
i
on
i
s
a
s
f
o
ll
ows
:
2005 2006 2007
NT$ NT$ NT$ US$(Note 3)
Balance of imputation credit account $ 101,702 $ 481,742 $ 1,857,935 $ 57,291
Unappropriated earnings generated from 1998 14,152,255 31,991,090 41,403,867 1,276,715
Expected creditable ratio (including income tax payable) 5.08% 7.00% 10.56% 10.56%
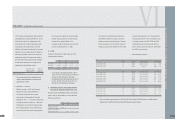
calculation was 573,414 thousand shares in 2005;
577,919 thousand shares in 2006; and 573,299
thousand shares in 2007. The EPS in 2005 and
2006 were calculated after the average number of
shares outstanding was adjusted retroactively for the
effect of stock dividend distribution in 2007.
24. EARNINGS PER SHARE
Earnings per share (EPS) before tax and after tax
are calculated by dividing net income by the
weighted average number of common shares
outstanding, which includes the deduction of the
effect of treasury stock during each year. The
weighted average number of shares used in EPS
VI
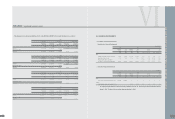
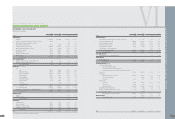
2005 2006 2007
NT$ NT$ NT$ US$(Note 3)
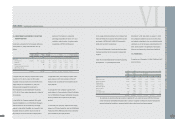
Temporary differences
Unrealized marketing expenses $ - $ 245,772 $ 751,755 $ 23,181
Unrealized bad debt expenses - - 16,151 498
Provision for loss on decline in value of inventory 146,682 222,916 229,072 7,064
Unrealized royalties 459,556 942,097 1,009,848 31,139
Capitalized expense 39,571 31,936 39,628 1,222
Unrealized reserve for warranty expense 241,126 348,499 867,489 26,750
Unrealized value loss on financial instruments - 19,117 24,064 742
Unrealized foreign exchange loss, net 21,220 - - -
Other 16,348 27,770 41,434 1,277
Tax credit carryforwards 378,236 - - -
Total deferred tax assets 1,302,739 1,838,107 2,979,441 91,873
Less valuation allowance ( 796,976) ( 1,134,041) ( 1,970,824) (6 0,772)
Total deferred tax assets, net 505,763 704,066 1,008,617 31,101
Deferred tax liabilities
Unrealized pension cost ( 11,882) ( 18,505) ( 23,797) ( 734)
Unrealized valuation gain on financial instruments ( 15,021) - - -
Unrealized foreign exchange gain, net - ( 38,254) (42,710) ( 1,317)
478,860 647,307 942,110 29,050
Less current portion ( 229,826) ( 428,077) ( 562,025) ( 17,330)
Deferred tax assets - noncurrent $ 249,034 $ 219,230 $ 380,085 $ 11,720
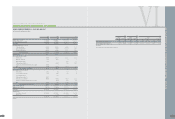
> D
e
t
a
il
s o
f
t
h
e
t
a
x
c
r
e
d
i
t
c
a
rry
f
orw
a
rds w
e
r
e
a
s
f
o
ll
ows
:
2005 2006 2007
Credit Grant Year Validity Period NT$ NT$ NT$ US$(Note 3)
2001 2001-2005 $ - $ - $ - $ -
2002 2002-2006 56,405 - -
2003 2003-2007 58,500 - - -
2004 2004-2008 - - - -
2005 2005-2009 263,331 - - -
$ 378,236 $ - $ - $ -
Based on the Income Tax Act of the ROC, the investment and research and development tax credits can be
carried forward for four years. The total credits used in each year cannot exceed half of the estimated income
tax provision, except in the last year.
FINANCEI INDEPENDENT AUDITORS' REPORT
l