HTC 2007 Annual Report Download - page 51
Download and view the complete annual report
Please find page 51 of the 2007 HTC annual report below. You can navigate through the pages in the report by either clicking on the pages listed below, or by using the keyword search tool below to find specific information within the annual report.-
 1
1 -
2
-
3
-
4
-
5
-
6
-
7
-
8
-
9
-
10
-
11
-
12
-
13
-
14
-
15
-
16
-
17
-
18
-
19
-
20
-
21
-
22
-
23
-
24
-
25
-
26
-
27
-
28
-
29
-
30
-
31
-
32
-
33
-
34
-
35
-
36
-
37
-
38
-
39
-
40
-
 41
41 -
 42
42 -
 43
43 -
 44
44 -
 45
45 -
 46
46 -
 47
47 -
 48
48 -
 49
49 -
 50
50 -
 51
51 -
 52
52 -
 53
53 -
 54
54 -
 55
55 -
 56
56 -
 57
57 -
 58
58 -
 59
59 -
 60
60 -
 61
61 -
62
-
63
-
64
-
65
-
66
-
67
-
68
-
69
-
70
-
71
-
72
-
73
-
74
-
75
-
76
-
77
-
78
-
79
-
80
-
81
-
82
-
83
-
84
-
85
-
86
-
87
-
88
-
89
-
90
-
91
-
92
-
93
-
94
-
95
-
96
-
97
-
98
-
99
-
100
-
101
-
102
-
103
-
104
-
105
-
106
-
107
-
108
-
109
-
110
-
111
-
112
-
113
-
114
-
115
-
116
-
117
-
118
-
119
-
120
-
121
-
122
-
123
-
124
-
125
-
126
-
127
-
128
 |
 |

9796
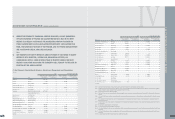
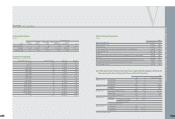
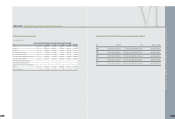
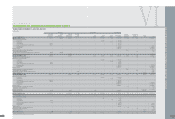
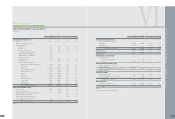
AN OVERVIEW OFTHE COMPANY'S FINANCIAL STATUS
(3) Th
e
N
a
m
e
o
f
Th
e
C
e
r
t
i
f
i
e
d Pub
li
c
A
cc
oun
t
a
n
t
a
nd Th
e
Aud
i
t
or's Op
i
n
i
on
Year CPA Firm CPA Auditor's Opinion
2003 Deloitte Touche Tohmatsu Tze-Chun Wang and Wen-Yea Shyu unqualified opinion
2004 Deloitte Touche Tohmatsu Ming-Hsien Yang and Wen-Yea Shyu unqualified opinion
2005 Deloitte Touche Tohmatsu Tze-Chun Wang and Kwan-Chung Lai unqualified opinion
2006 Deloitte Touche Tohmatsu Tze-Chun Wang and Kwan-Chung Lai unqualified opinion
2007 Deloitte Touche Tohmatsu Ming-Hsien Yang and Kwan-Chung Lai unqualified opinion
VI
(2) Abbr
e
v
i
a
t
e
d In
c
om
e
S
t
a
t
e
m
e
n
t
s
N
T$ thousands
(
Except EP
S
:
N
T$
)
Year
Item 2007 2006 2005 2004 2003 2008.03.31
Revenues 118,579,958 104,816,548 72,768,522 36,397,166 21,821,605 32,703,364
Gross profit 45,699,786 34,037,482 18,010,482 7,904,022 3,882,961 11,655,748
Operatng income 31,023,425 26,551,966 12,840,479 4,310,420 1,819,460 7,455,965
Non operating income and gains 1,810,908 1,234,336 217,975 312,956 482,678 782,873
Non operating expenses and losses 683,036 828,424 902,515 662,848 342,293 583,945
Income from continuing operations before income tax 32,151,297 26,957,878 12,155,939 3,960,528 1,959,845 7,654,893
Income from continuing operations 28,938,862 25,247,327 11,781,944 3,855,346 1,850,732 6,944,583
Income (loss) from discontinued operations -- - - - -
Income (loss) from extraordinary items -- - - - -
Cumulative effect of changes in accounting principle -- - -- -
Net income 28,938,862 25,247,327 11,781,944 3,855,346 1,850,732 6,944,583
Basic earnings per share 50.48 43.69 20.55 7.10 3.64 12.12
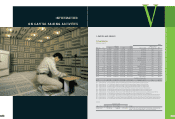
FINANCE
l
ABBREVIATED
F
INANCIAL REPORTS
F
OR THE PAST
F
IVE
F
ISCAL YEARS
l