HTC 2007 Annual Report Download - page 46
Download and view the complete annual report
Please find page 46 of the 2007 HTC annual report below. You can navigate through the pages in the report by either clicking on the pages listed below, or by using the keyword search tool below to find specific information within the annual report.-
 1
1 -
2
-
3
-
4
-
5
-
6
-
7
-
8
-
9
-
10
-
11
-
12
-
13
-
14
-
15
-
16
-
17
-
18
-
19
-
20
-
21
-
22
-
23
-
24
-
25
-
26
-
27
-
28
-
29
-
30
-
31
-
32
-
33
-
34
-
35
-
 36
36 -
 37
37 -
 38
38 -
 39
39 -
 40
40 -
 41
41 -
 42
42 -
 43
43 -
 44
44 -
 45
45 -
 46
46 -
 47
47 -
 48
48 -
 49
49 -
 50
50 -
 51
51 -
 52
52 -
 53
53 -
 54
54 -
 55
55 -
 56
56 -
57
-
58
-
59
-
60
-
61
-
62
-
63
-
64
-
65
-
66
-
67
-
68
-
69
-
70
-
71
-
72
-
73
-
74
-
75
-
76
-
77
-
78
-
79
-
80
-
81
-
82
-
83
-
84
-
85
-
86
-
87
-
88
-
89
-
90
-
91
-
92
-
93
-
94
-
95
-
96
-
97
-
98
-
99
-
100
-
101
-
102
-
103
-
104
-
105
-
106
-
107
-
108
-
109
-
110
-
111
-
112
-
113
-
114
-
115
-
116
-
117
-
118
-
119
-
120
-
121
-
122
-
123
-
124
-
125
-
126
-
127
-
128
 |
 |

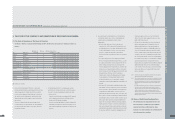
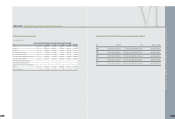
INFORMATION ON CAPITAL RAISING ACTIVITIES
87
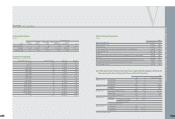
(4) L
i
s
t
o
f
Pr
i
n
c
i
p
a
l
Sh
a
r
e
ho
l
d
e
rs
:
04/15/2008
Shares
Name of principal shareholders Current Shareholding Percentage
Way-Chih Investment Co., LTD. 29,117,502 5.08%
Way-Lien Technology. 27,997,511 4.88%
Euro Pacific Growth Fund Special Account under custodial administration of Chase Manhattan Bank 25,558,000 4.46%
Hon-Mou Investment Co., Ltd. 18,571,103 3.24%
Cher Wang 18,122,269 3.16%
New Horizon Fund, Company Investment Special Account under custodial administration of Chase Manhattan Bank 14,891,200 2.60%
Wen-Chi Chen 14,878,866 2.60%
Brookside Capital Partners Fund LP under custodial administration of The Hongkong and Shanghai Banking Corporation, Limited
14,564,000 2.54%
HTC Depositary Receipts Special Account under custodial administration of Citibank N.A. 9,848,192 1.72%
Kuan Tseng Investment Co., Ltd. 8,467,785 1.48%
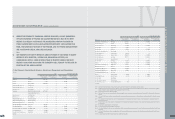
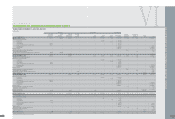
(5) Prov
i
d
e
Sh
a
r
e
Pr
i
c
e
s
f
or Th
e
P
a
s
t
Two
F
i
s
c
a
l
Y
ea
rs, Tog
e
t
h
e
r w
i
t
h Th
e
Comp
a
ny's N
e
t
Wor
t
h P
e
r
Sh
a
r
e
, E
a
rn
i
ngs P
e
r Sh
a
r
e
, D
i
v
i
d
e
nds P
e
r Sh
a
r
e
,
a
nd R
e
l
a
t
e
d In
f
orm
a
t
i
on
:
Year
Item 2006 2007 01/01/2008 ~03/31/2008
Market price per share Highest market price 1,220 703 690
Lowest market price 593 390 503
Average market price 825.32 548.64 618.49
Net worth per share(note) Before distribution 97.55 97.84 109.80
After distribution 74.28 (note) (note)
Earnings per share Weighted average shares(thousand shares) 436,409 573,229 573,229
Earnings per share 57.85 50.48 50.48
Retroactively adjusted earnings per share 43.69 (note) (note)
Dividends per share Cash dividends 27 34 (note) -
Stock dividends Dividends from retained earnings 0.3 0.3 (note) -
Dividends from capital surplus - --
Accumulated undistributed dividend - --
Reutrn on investment Price/Earnings ration 14.27 10.87 -
Price/Dividend ratio 30.57 16.14 (note) -
Cash dividend yield 3.27% 6.2% (note) -
N
ote : Pending 2008 shareholders
'
approval
86
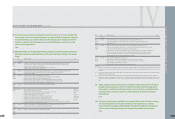
(2) Sh
a
r
e
ho
l
d
e
r S
t
ru
c
t
ur
e
:
04/15/2008
Shareholder structure
Government Financial Other Juridical Foreign Institutions & Domestic
Number Agencies Institutions Persons Natural Persons Natural Persons Total
Number of shareholders 1 35 388 1,013 21,284 22,721
Shareholding 2,975,284 23,242,423 129,457,871 312,141,669 105,316,489 573,133,736
Holding percentage 0.52% 4.06% 22.59% 54.45% 18.38% 100.00%
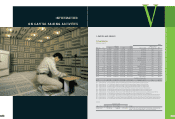
(3) D
i
ff
us
i
on o
f
Own
e
rsh
i
p
:
each share having a par value of
N
T$10 04/15/2008
Shareholder Ownership (Unit : share) Number of Shareholders Ownership Ownership
1~999 7,331 2,132,210 0.37%
1,000~5,000 12,014 22,103,114 3.86%
5,001~10,000 1,279 9,381,506 1.64%
10,001~15,000 484 5,976,517 1.04%
15,001~20,000 289 5,173,291 0.90%
20,001~30,000 291 7,187,380 1.25%
30,001~40,000 157 5,587,327 0.97%
40,001~50,000 111 5,080,753 0.89%
50,001~100,000 273 19,771,878 3.45%
100,001~200,000 188 26,518,414 4.63%
200,001~400,000 119 34,221,225 5.97%
400,001~600,000 53 25,733,865 4.49%
600,001~800,000 33 22,223,175 3.88%
800,001~1,000,000 14 12,634,729 2.20%
Over 1,000,001 85 369,408,352 64.46%
Total 22,721 573,133,736 100.00%
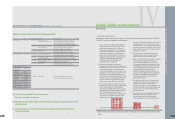
V
CAPITAL
l
CAPITAL AND SHARES
l