HTC 2007 Annual Report Download - page 52
Download and view the complete annual report
Please find page 52 of the 2007 HTC annual report below. You can navigate through the pages in the report by either clicking on the pages listed below, or by using the keyword search tool below to find specific information within the annual report.-
 1
1 -
2
-
3
-
4
-
5
-
6
-
7
-
8
-
9
-
10
-
11
-
12
-
13
-
14
-
15
-
16
-
17
-
18
-
19
-
20
-
21
-
22
-
23
-
24
-
25
-
26
-
27
-
28
-
29
-
30
-
31
-
32
-
33
-
34
-
35
-
36
-
37
-
38
-
39
-
40
-
41
-
 42
42 -
 43
43 -
 44
44 -
 45
45 -
 46
46 -
 47
47 -
 48
48 -
 49
49 -
 50
50 -
 51
51 -
 52
52 -
 53
53 -
 54
54 -
 55
55 -
 56
56 -
 57
57 -
 58
58 -
 59
59 -
 60
60 -
 61
61 -
 62
62 -
63
-
64
-
65
-
66
-
67
-
68
-
69
-
70
-
71
-
72
-
73
-
74
-
75
-
76
-
77
-
78
-
79
-
80
-
81
-
82
-
83
-
84
-
85
-
86
-
87
-
88
-
89
-
90
-
91
-
92
-
93
-
94
-
95
-
96
-
97
-
98
-
99
-
100
-
101
-
102
-
103
-
104
-
105
-
106
-
107
-
108
-
109
-
110
-
111
-
112
-
113
-
114
-
115
-
116
-
117
-
118
-
119
-
120
-
121
-
122
-
123
-
124
-
125
-
126
-
127
-
128
 |
 |

9998
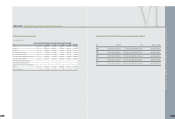
AN OVERVIEW OFTHE COMPANY'S FINANCIAL STATUS
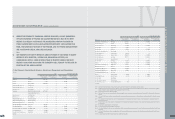
Please explain reasons for the changes in the various financial
ratios during the most recent two fiscal years (analysis not required
for increases or decreases less than 20%).
1. Increase in interest coverage ratio: the primary reason was
an increase in operating revenues for the current period and
the large increase in pre-tax income.
2. Slight decrease in receivables turnover rate: There was a
gradual shift in operations this year from contracted
manufacturing to original brand manufacturing, which, with
effective credit control and debt recovery, resulted in a very
slight drop in the receivables recovery rate compared with
the previous period.
3. Slight drop in inventory turnover rate: The shift in
operations resulted in an inventory turnover rate lower by
1.24% than the previous period.
4. Reduction in return on assets: The reduction resulted
primarily from the increase in operating revenues during
this period, meaning there was an increase in related cash
and inventory assets; new investments and contracted
building of plants and offices on HTC land were also
completed, further increasing assets. While net income for
the period also increased, the amount of the increase failed
to match the average rate of increase in total assets,
resulting in a reduction in return on assets for the period.
5. Reduction in return on equity: While net income for the
period increased along with the growth in operating
revenues, its increase failed to match the average rate of
increase in net shareholder equity, resulting in a reduction
in return on equity.
VI
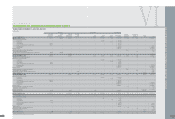
2.
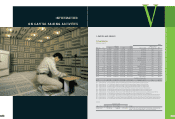
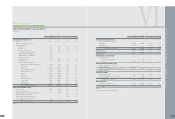
F
INANCIAL ANALYSIS
F
OR THE PAST
F
IVE
F
ISCAL YEARS
(1)
F
i
n
a
n
c
i
a
l
An
a
l
ys
i
s
U
nit:
N
T$ thousands
Yesr
Item 2007 2006 2005 2004 2003 2008.03.31
Capital Structure Analysis Debt Ratio (%) 38 35 42 50 52 35
Long-term fund to Fixed Asset Ratio (%) 1,509 1,463 921 510 342 1,703
Liquidity Analysis Current Ratio (%) 242 264 216 206 160 264
Quick Ratio (%) 218 233 183 157 127 235
Times Interest Earned (times) 133,409 90,464 614 136 73 225,145
Operating Performance Analysis Average Collection Turnover (times) 6.01 6.09 6.25 5.21 4.32 7.13
Days Sales Outstanding 61 60 58 70 84 51
Average Inventory Turnover (times) 11.29 12.53 10.98 8.34 8.57 10.58
Average Payment Turnover (times) 3.75 4.62 5.04 4.42 4.10 4.10
Average Inventory Turnover Days 32 29 33 44 43 34
Fixed Assets Turnover (times) 31.91 36.02 29.16 14.45 9.77 35.40
Total Assets Turnover (times) 1.31 1.59 1.82 1.61 1.38 1.35
Profitability Analysis Return on Total Assets (%) 37 48 38 20 15 30
Return on Equity (%) 59 77 69 41 31 47
Operating Income to Paid-in Capital Ratio (%) 541 608 360 156 84 130
Pre-tax Income to Paid-in Capital Ratio (%) 561 618 340 143 90 134
Net Margin (%) 24 24 16 11 8 21
Basic Earnings Per Share (NT$) 50.48 43.69 20.55 7.10 3.64 12.12
Cash Flow Cash Flow Ratio (%) 116 106 75 31 25 25
Cash Flow Adequacy Ratio (%) 291 296 196 72 58 305
Cash Flow Reinvestment Ratio (%) 47 44 44 15 19 52
Leverage Operating Leverage 1.20 1.16 1.26 1.70 2.10 1.24
Financial Leverage 1.00 1.00 1.00 1.01 1.02 1.00
FINANCE
l
F
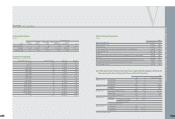
INANCIAL ANALYSIS
F
OR THE PAST
F
IVE
F
ISCAL YEARS
l
*Glossary
1. Capital
S
tructure Analysis
(
1
)
D
ebt
R
atio
=
Total
L
iabilities / Total Assets.
(
2
)
L
ong-ter
m
Fund to Fixed Assets
R
atio
=
(
S
hareholders
'
Equity
+
L
ong-ter
m
L
iabilities
)
/
N
et Fixed Assets.
2.
L
iquidity Analysis
(
1
)
Current
R
atio
=
Current Assets / Current
L
iabilities.
(
2
)
Q
uick
R
ratio
=
(
Current Assets - Inventories - Prepaid Expenses
)
/ Current
L
iabilities.
(
3
)
Ti
m
es Interest Earned
=
Earnings before Interest and Taxes / Interest Expenses.
3.
O
perating Perfor
m
ance Analysis
(
1
)
Average Collection Turnover
=
N
et
S
ales / Average Trade
R
eceivables.
(
2
)
D
ays
S
ales
O
utstanding
=
365 / Average Collection Turnover.
(
3
)
Average Inventory Turnover
=
Cost of
S
ales / Average Inventory.
(
4
)
Average Pay
m
ent Turnover
=
Cost of
S
ales / Average Trade Payables.
(
5
)
Average Inventory Turnover
D
ays
=
365 / Average Inventory Turnover.
(
6
)
Fixed Assets Turnover
=
N
et
S
ales /
N
et Fixed Assets.
(
7
)
Total Assets Turnover
=
N
et
S
ales / Total Assets.
4. Profitability Analysis
(
1
)
R
eturn on Total Assets
=
(
N
et Inco
m
e
+
Interest Expenses*
(
1 - Effective Tax
R
ate
)
)
/
Average Total Assets.
(
2
)
R
eturn on Equity
=
N
et Inco
m
e / Average
S
hareholders
'
Equity
(
3
)
N
et Margin
=
N
et Inco
m
e /
N
et
S
ales.
(
4
)
Earnings Per
S
hare
=
(
N
et Inco
m
e - Preferred
S
tock
D
ividend
)
/
W
eighted Average
N
u
m
ber of
S
hares
O
utstanding.
5. Cash Flow
(
1
)
Cash Flow
R
atio
=
N
et Cash Provided by
O
perating Activities / Current
L
iabilities.
(
2
)
Cash Flow Adequacy
R
atio
=
Five-year
S
u
m
of Cash fro
m
O
perations / Five-year
S
u
m
of Capital Expenditures, Inventory Additions, and Cash
D
ividend.
(
3
)
Cash Flow
R
einvest
m
ent
R
atio
=
(
Cash Provided by
O
perating Activities - Cash
D
ividends
)
/
(
G
ross Fixed Assets
+
Invest
m
ents
+
O
ther Assets
+
W
orking Capital
)
.
6.
L
everage
(
1
)
O
perating
L
everage
=
(
N
et
S
ales - Variable Cost
)
/ Inco
m
e fro
m
O
perations.
(
2
)
Financial
L
everage
=
Inco
m
e fro
m
O
perations /
(
Inco
m
e fro
m
O
perations - Interest
Expenses
)
.