HTC 2007 Annual Report Download - page 100
Download and view the complete annual report
Please find page 100 of the 2007 HTC annual report below. You can navigate through the pages in the report by either clicking on the pages listed below, or by using the keyword search tool below to find specific information within the annual report.-
 1
1 -
2
-
3
-
4
-
5
-
6
-
7
-
8
-
9
-
10
-
11
-
12
-
13
-
14
-
15
-
16
-
17
-
18
-
19
-
20
-
21
-
22
-
23
-
24
-
25
-
26
-
27
-
28
-
29
-
30
-
31
-
32
-
33
-
34
-
35
-
36
-
37
-
38
-
39
-
40
-
41
-
42
-
43
-
44
-
45
-
46
-
47
-
48
-
49
-
50
-
51
-
52
-
53
-
54
-
55
-
56
-
57
-
58
-
59
-
60
-
61
-
62
-
63
-
64
-
65
-
66
-
67
-
68
-
69
-
70
-
71
-
72
-
73
-
74
-
75
-
76
-
77
-
78
-
79
-
80
-
81
-
82
-
83
-
84
-
85
-
86
-
87
-
88
-
89
-
 90
90 -
 91
91 -
 92
92 -
 93
93 -
 94
94 -
 95
95 -
 96
96 -
 97
97 -
 98
98 -
 99
99 -
 100
100 -
 101
101 -
 102
102 -
 103
103 -
 104
104 -
 105
105 -
 106
106 -
 107
107 -
 108
108 -
 109
109 -
 110
110 -
111
-
112
-
113
-
114
-
115
-
116
-
117
-
118
-
119
-
120
-
121
-
122
-
123
-
124
-
125
-
126
-
127
-
128
 |
 |

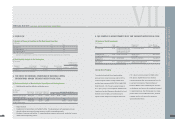
AN OVERVIEW OFTHE COMPANY'S FINANCIAL STATUS
195194
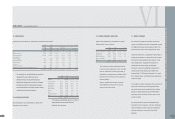
There was no loss or gain recognized in 2007
on the fair value changes of derivatives
estimated using valuation techniques. The
Company recognized unrealized gains of
NT$133 thousand and NT$849 thousand and a
loss of NT$949 thousand (US$30 thousand) in
stockholders' equity for the changes in fair value
of available-for-sale financial assets for 2005,
2006 and 2007, respectively.
As of December 31, 2005, 2006 and 2007,
financial assets exposed to cash flow interest
rate risk amounted to NT$9,716,900 thousand,
NT$30,468,400 thousand and NT$46,613,935
thousand (US$1,437,371 thousand),
respectively.
As of December 31, 2007, financial assets and
liabilities exposed to fair value interest rate risk
amounted to NT$33,030 thousand (US$1,019
thousand) and NT$96,250 thousand (US$2,968
thousand), respectively.
>
F
i
n
a
n
c
i
a
l
R
i
s
k
s
• Market Risk
The Company uses derivative contracts for
hedging purposes, i.e., to reduce any adverse
effect of exchange rate fluctuations of
accounts receivable/payable. The gains or
losses on these contracts almost offset the
gains or losses on the hedged items. Thus,
market risk is not material.
• Credit Risk
The Company deals only with banks with
good credit standing based on the banks'
reputation and takes into account past
experience with them. Moreover, the
Company has a series of control procedures
for derivative transactions. Management
believes its exposure to counter-parties'
default on contracts is low.
• Cash Flow Risk
The Company has sufficient working capital to
settle derivative contracts. However, there are
no future cash requirements for contract
settlement.
VI
> M
e
t
hods
a
nd Assump
t
i
ons Us
e
d
i
n D
e
t
e
rm
i
n
i
ng
Fa
i
r
V
a
l
u
e
s o
f
F
i
n
a
n
c
i
a
l
Ins
t
rum
e
n
t
s
Not subject to SFAS No. 34 are cash and cash
equivalents, receivables, other current financial
assets, payables, accrued expenses and other
current financial liabilities, which have carrying
amounts that approximate their fair values.
The financial instruments neither include bonds
payable and refundable deposits nor guarantee
deposits. The fair values of bonds payable,
refundable deposits and guarantee deposits
received are based on the present value of
future cash flows discounted at the average
interest rates for time deposits with maturities
similar to those of the financial instruments.
Fair values of long-term bank loans were based
on the present value of expected cash flows,
which approximates their carrying amount.
The fair values of financial instruments at fair
value through profit or loss and available-for-
sale financial assets are based on quoted
market prices in an active market, and their fair
values can be reliably measured. If the
securities do not have market prices, fair value
is measured on the basis of financial or other
information. The Company uses estimates and
assumptions that are consistent with information
that market participants would use in setting a
price for these securities.
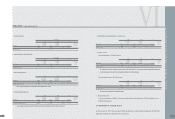
> M
e
t
hodo
l
ogy Us
e
d
t
o D
e
t
e
rm
i
n
e
t
h
e
Fa
i
r V
a
l
u
e
s o
f
F
i
n
a
n
c
i
a
l
Ins
t
rum
e
n
t
s
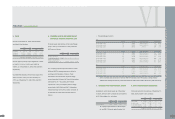
Quoted Market Prices Measurement Method
December 31 December 31
2005 2006 2007 2005 2006 2007
NT$ NT$ NT$ US$(Note 3) NT$ NT$ NT$ US$(Note 3)
Assets
Financial assets at fair value through profit or loss $ 60,085 $ - $ - $ - $ - $ - $ - $ -
Available-for-sale financial assets - noncurrent 836 1,733 784 24 - - - -
Financial assets carried at cost - - - - 1,192 1,192 501,192 15,455
Bond investments with no active market - - - - - - 33,030 1,019
Liabilities
Financial liabilities at fair value through profit or loss - 76,470 96,256 2,968 - - - -
FINANCEI CONSOLIDATED REPORT
l