HTC 2007 Annual Report Download - page 80
Download and view the complete annual report
Please find page 80 of the 2007 HTC annual report below. You can navigate through the pages in the report by either clicking on the pages listed below, or by using the keyword search tool below to find specific information within the annual report.-
 1
1 -
2
-
3
-
4
-
5
-
6
-
7
-
8
-
9
-
10
-
11
-
12
-
13
-
14
-
15
-
16
-
17
-
18
-
19
-
20
-
21
-
22
-
23
-
24
-
25
-
26
-
27
-
28
-
29
-
30
-
31
-
32
-
33
-
34
-
35
-
36
-
37
-
38
-
39
-
40
-
41
-
42
-
43
-
44
-
45
-
46
-
47
-
48
-
49
-
50
-
51
-
52
-
53
-
54
-
55
-
56
-
57
-
58
-
59
-
60
-
61
-
62
-
63
-
64
-
65
-
66
-
67
-
68
-
69
-
 70
70 -
 71
71 -
 72
72 -
 73
73 -
 74
74 -
 75
75 -
 76
76 -
 77
77 -
 78
78 -
 79
79 -
 80
80 -
 81
81 -
 82
82 -
 83
83 -
 84
84 -
 85
85 -
 86
86 -
 87
87 -
 88
88 -
 89
89 -
 90
90 -
91
-
92
-
93
-
94
-
95
-
96
-
97
-
98
-
99
-
100
-
101
-
102
-
103
-
104
-
105
-
106
-
107
-
108
-
109
-
110
-
111
-
112
-
113
-
114
-
115
-
116
-
117
-
118
-
119
-
120
-
121
-
122
-
123
-
124
-
125
-
126
-
127
-
128
 |
 |

155154
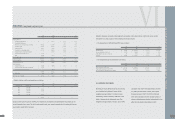
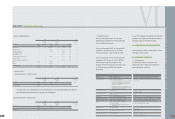
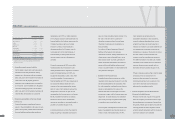
AN OVERVIEW OFTHE COMPANY'S FINANCIAL STATUS
2005 2006 2007
Before After Before After Before After
Income Tax Income Tax Income Tax Income Tax Income Tax Income Tax
NT$ NT$ NT$ NT$ NT$ US$ (Note 3) NT$ US$(Note 3)
BASIC EARNINGS PER SHARE (Note 24) $ 21.20 $ 20.55 $ 46.65 $ 43.69 $ 56.08 $ 1.73 $ 50.48 $ 1.56
DILUTED EARNINGS PER SHARE (Note 24) $ 21.02 $ 20.37 $ 46.11 $ 43.18 $ 56.08 $ 1.73 $ 50.48 $ 1.56
(Concluded)
The acco
m
panying notes are an integral part of the financial state
m
ents.
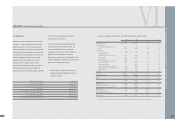
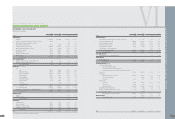
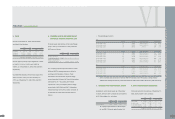
VI
H I G H T E C H C O M P U T E R C O R P. A N D S U B S I D I A R I E S
CONSOLIDATED STATEMENTS O
F
INCOME
YEARS ENDED DECEMBER 31, 2005, 2006 AND 2007
(In Thousands, Except Earnings Per Share)
2005 2006 2007
NT$ NT$ NT$ US$ (Note 3)
REVENUES (Notes 2 and 26) $ 73,144,654 $ 105,358,397 $ 118,217,545 $ 3,645,314
COST OF REVENUES (Notes 22 and 26) 55,238,941 72,066,150 73,393,757 2,263,144
GROSS PROFIT 17,905,713 33,292,247 44,823,788 1,382,170
OPERATING EXPENSES (Notes 22 and 26)
Selling and marketing 2,110,805 3,025,640 8,488,466 261,747
General and administrative 590,592 770,545 1,310,650 40,415
Research and development 2,399,315 2,974,003 3,705,261 114,254
Total operating expenses 5,100,712 6,770,188 13,504,377 416,416
OPERATING INCOME 12,805,001 26,522,059 31,319,411 965,754
NONOPERATING INCOME AND GAINS
Interest income 147,820 445,121 828,012 25,532
Gain on sale of properties 5,372 39,111 77 2
Gain on physical inventory 3,474 - 25,538 787
Foreign exchange gain (Note 2) - 626,464 707,642 21,821
Valuation gains on financial instruments (Notes 2, 4 and 6) 60,085 - - -
Other 80,788 173,356 236,115 7,281
Total nonoperating income and gains 297,539 1,284,052 1,797,384 55,423
NONOPERATING EXPENSES AND LOSSES
Interest expense 19,821 298 1,212 37
Losses on disposal of properties 2,576 3,412 1,396 43
Loss on physical inventory - 1,121 - -
Foreign exchange loss (Note 2) 301,437 - - -
Provision for loss on inventories 598,549 774,944 684,694 21,113
Valuation loss on financial instruments (Notes 2, 4 and 6) - 76,470 96,256 2,968
Other 22,012 7,149 101,301 3,124
Total nonoperating expenses and losses 944,395 863,394 884,859 27,285
INCOME BEFORE INCOME TAX 12,158,145 26,942,717 32,231,936 993,892
INCOME TAX (Notes 2 and 23) (376,201) (1,708,375 ) (3,314,224 ) (102,196)
NET INCOME $ 11,781,944 $ 25,234,342 $ 28,917,712 $ 891,696
ATTRIBUTABLE TO
Stockholders of the parent $ 11,781,944 $ 25,247,327 $ 28,938,862 $ 892,348
Minority interest - (12,985 ) (21,150 ) (652)
$ 11,781,944 $ 25,234,342 $ 28,917,712 $ 891,696
(Continue)