HTC 2007 Annual Report Download - page 54
Download and view the complete annual report
Please find page 54 of the 2007 HTC annual report below. You can navigate through the pages in the report by either clicking on the pages listed below, or by using the keyword search tool below to find specific information within the annual report.-
 1
1 -
2
-
3
-
4
-
5
-
6
-
7
-
8
-
9
-
10
-
11
-
12
-
13
-
14
-
15
-
16
-
17
-
18
-
19
-
20
-
21
-
22
-
23
-
24
-
25
-
26
-
27
-
28
-
29
-
30
-
31
-
32
-
33
-
34
-
35
-
36
-
37
-
38
-
39
-
40
-
41
-
42
-
43
-
 44
44 -
 45
45 -
 46
46 -
 47
47 -
 48
48 -
 49
49 -
 50
50 -
 51
51 -
 52
52 -
 53
53 -
 54
54 -
 55
55 -
 56
56 -
 57
57 -
 58
58 -
 59
59 -
 60
60 -
 61
61 -
 62
62 -
 63
63 -
 64
64 -
65
-
66
-
67
-
68
-
69
-
70
-
71
-
72
-
73
-
74
-
75
-
76
-
77
-
78
-
79
-
80
-
81
-
82
-
83
-
84
-
85
-
86
-
87
-
88
-
89
-
90
-
91
-
92
-
93
-
94
-
95
-
96
-
97
-
98
-
99
-
100
-
101
-
102
-
103
-
104
-
105
-
106
-
107
-
108
-
109
-
110
-
111
-
112
-
113
-
114
-
115
-
116
-
117
-
118
-
119
-
120
-
121
-
122
-
123
-
124
-
125
-
126
-
127
-
128
 |
 |

103102
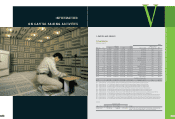
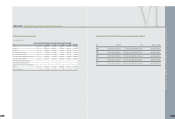
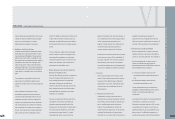
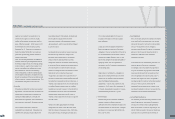
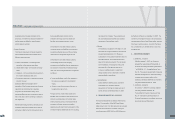
AN OVERVIEW OFTHE COMPANY'S FINANCIAL STATUS
VI
2005 2006 2007
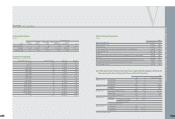
LIABILITIES AND STOCKHOLDERS' EQUITY NT$ NT$ NT$ US$ (Note 3)
CURRENT LIABILITIES
Financial liabilities at fair value through profit or loss (Notes 2, 4, 6 and 25) $ - $ 76,470 $ 96,256 $ 2,968
Notes and accounts payable (Note 26) 13,796,693 16,847,039 22,020,118 679,005
Income tax payable (Notes 2 and 23) 616,863 1,758,717 2,514,394 77,533
Accrued expenses (Notes 16 and 26) 1,204,807 2,340,129 5,269,829 162,498
Payable for purchase of equipment 14,039 35,342 170,184 5,248
Other current liabilities (Notes 17 and 26) 1,302,768 2,363,622 4,297,358 132,512
Total current liabilities 16,935,170 23,421,319 34,368,139 1,059,764
OTHER LIABILITIES
Guarantee deposits received 561 640 628 19
Total liabilities 16,935,731 23,421,959 34,368,767 1,059,783
STOCKHOLDERS' EQUITY (Note 20)
Capital stock - NT$10.00 par value
Authorized: 650,000 thousand shares
Issued and outstanding: 357,016 thousand shares in 2005,
436,419 thousand shares in 2006 and 573,134 thousand shares in 2007
Common stock 3,570,160 4,364,192 5,731,337 176,729
Capital surplus
Additional paid-in capital - common stock 4,410,871 4,410,871 4,374,244 134,883
Long-term equity investments - 15,845 15,845 489
From merger 25,972 25,972 25,756 794
Retained earnings
Legal reserve 813,326 1,991,520 4,516,253 139,262
Special reserve 19,133 6,175 - -
Unappropriated earnings 14,152,255 31,991,090 41,403,867 1,276,715
Cumulative translation adjustments (Note 2) (5,041 ) 10,786 9,664 298
Unrealized loss on financial instruments (Notes 2, 4 and 7) (1,135 ) (238 ) (1,187 ) (37 )
Treasury stock (Notes 2 and 21) - (243,995 ) - -
Total stockholders' equity 22,985,541 42,572,218 56,075,779 1,729,133
TOTAL $ 39,921,272 $ 65,994,177 $ 90,444,546 $ 2,788,916
(
Concluded
)
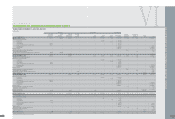
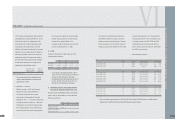
H I G H T E C H C O M P U T E R C O R P.
BALANCE SHEETS
DECEMBER 31, 2005, 2006 AND 2007
(In Thousands, Except Par Value)
2005 2006 2007
ASSETS NT$ NT$ NT$ US$ (Note 3)
CURRENT ASSETS
Cash (Note 5) $ 16,196,448 $ 34,397,388 $ 55,036,232 $ 1,697,078
Financial assets at fair value through profit or loss (Notes 2, 4, 6 and 25) 60,085 - - -
Bond investments with no active market (Notes 2 and 13) - - 33,030 1,019
Notes receivable, net (Notes 2 and 8) 99,087 58,930 3,058 94
Accounts receivable, net (Notes 2 and 8) 14,212,815 18,317,979 18,943,867 584,146
Accounts receivable from related parties, net (Notes 2and 26) 420,780 1,311,790 536,875 16,555
Other current financial assets (Notes 9 and 26) 54,994 368,497 284,051 8,759
Inventories (Notes 2 and 10) 4,837,553 4,983,891 6,119,413 188,696
Prepayments (Notes 11 and 26) 474,261 1,881,119 1,537,327 47,405
Deferred income tax assets (Notes 2 and 23) 229,826 428,077 562,025 17,330
Other current assets 30,325 63,101 116,841 3,603
Total current assets 36,616,174 61,810,772 83,172,719 2,564,685
LONG-TERM INVESTMENTS
Available-for-sale financial assets - noncurrent (Notes 2 and 7) 836 1,733 784 24
Financial assets carried at cost (Notes 2 and 12) 1,192 1,192 501,192 15,455
Investments accounted for by the equity method (Notes 2 and 14) 323,505 559,877 2,397,133 73,917
Prepayments for long-term investments (Notes 2 and 14) - 261,679 - -
Total long-term investments 325,533 824,481 2,899,109 89,396
PROPERTIES (Notes 2, 15 and 26)
Cost Land 610,293 610,293 610,293 18,819
Buildings and structures 1,073,560 1,083,065 2,239,919 69,069
Machinery and equipment 2,543,396 2,913,495 3,336,489 102,883
Molding equipment 201,567 201,247 201,247 6,206
Computer equipment 161,459 180,855 212,623 6,556
Transportation equipment 1,628 1,938 1,335 41
Furniture and fixtures 107,505 105,016 115,696 3,568
Leased assets - 4,712 4,712 145
Leasehold improvements 22,816 22,816 44,487 1,372
Total cost 4,722,224 5,123,437 6,766,801 208,659
Less accumulated depreciation (2,254,435 ) (2,684,143 ) (3,196,844 ) (98,577 )
Prepayments for construction-in-progress and equipment-in-transit 27,467 470,330 145,944 4,500
Properties, net 2,495,256 2,909,624 3,715,901 114,582
OTHER ASSETS
Refundable deposits 35,278 36,991 93,437 2,881
Deferred charges (Note 2) 150,237 119,059 88,108 2,717
Deferred tax assets (Notes 2 and 23) 249,034 219,230 380,085 11,720
Prepaid pension cost (Notes 2 and 19) 49,760 74,020 95,187 2,935
Total other assets 484,309 449,300 656,817 20,253
TOTAL $ 39,921,272 $ 65,994,177 $ 90,444,546 $ 2,788,916
(
Continue
)
The acco
m
panying notes are an integral part of the financial state
m
ents.