HTC 2007 Annual Report Download - page 57
Download and view the complete annual report
Please find page 57 of the 2007 HTC annual report below. You can navigate through the pages in the report by either clicking on the pages listed below, or by using the keyword search tool below to find specific information within the annual report.
109108
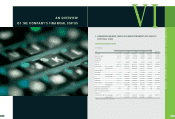
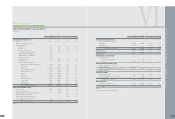
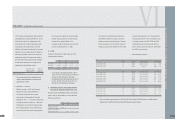
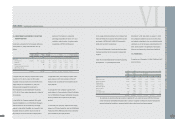
AN OVERVIEW OFTHE COMPANY'S FINANCIAL STATUS
2005 2006 2007
NT$ NT$ NT$ US$ (Note 3)
CASH
F
LOWS
F
ROM
F
INANCING ACTIVITIES
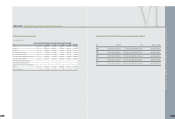
(Decrease) increase in guarantee deposits received ($ 272,517) $ 79 ($ 12) $ -
Cash dividends ( 1,443,816) ( 4,998,224) ( 11,685,470) ( 360,329)
Bonus to employees ( 210,500) - ( 2,451,000) ( 75,578)
Purchase of treasury stock - ( 243,995) ( 1,747,760) ( 53,893)
Net cash used in financing activities ( 1,926,833) ( 5,242,140) ( 15,884,242) ( 489,800)
NET INCREASE IN CASH 10,048,247 18,200,940 20,638,844 636,412
CASH, BEGINNING OF YEAR 6,148,201 16,196,448 34,397,388 1,060,666
CASH, END OF YEAR $ 16,196,448 $ 34,397,388 $ 55,036,232 $ 1,697,078
SUPPLEMENTAL CASH
F
LOW IN
F
ORMATION
Cash paid during the year
Interest (net of amounts capitalized) $ - $ 298 $ 241 $ 7
Income tax $ 107,456 $ 737,145 $ 2,751,561 $ 84,846
NONCASH INVESTING AND
F
INANCING ACTIVITIES
Transfer of convertible bonds to common stock and
additional paid-in capital $ 1,471,034 $ - $ - -
Transfer of retained earnings and employee bonuses to common stock $ 682,527 $ 794,032 $ 1,403,385 43,274
Retirement of treasury stock $ - $ - $ 1,991,755 61,417
PURCHASE O
F
PROPERTIES
Cost of properties purchased $ 561,712 $ 1,022,430 $ 1,335,029 $ 41,166
Decrease (increase) in payable for purchase of equipment 40,203 ( 21,303) ( 134,842) ( 4,158)
Increase in lease payable - ( 3,894) 876 27
Cash paid for purchase of properties $ 601,915 $ 997,233 $ 1,201,063 $ 37,035
BONUS TO EMPLOYEES
Appropriation of bonus to employees $ 206,000 $ 451,000 $ 2,000,000 $ 61,671
Decrease (increase) in payable for employee bonus 4,500 ( 451,000) 451,000 13,907
Cash paid $ 210,500 $ - $ 2,451,000 $ 75,578
(
Concluded
)
The acco
m
panying notes are an integral part of the financial state
m
ents.
VI
H I G H T E C H C O M P U T E R C O R P.
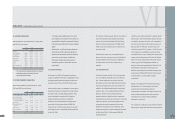
STATEMENTS O
F
CASH
F
LOWS
YEARS ENDED DECEMBER 31, 2005, 2006 AND 2007
(In Thousands)
2005 2006 2007
NT$ NT$ NT$ US$ (Note 3)
CASH
F
LOWS
F
ROM OPERATING ACTIVITIES
Net income $ 11,781,944 $ 25,247,327 $ 28,938,862 $ 892,348
Adjustments to reconcile net income to net cash
provided by operating activities
Depreciation 582,367 601,382 525,055 16,190
Amortization 35,974 31,178 30,951 954
Gain on disposal of properties, net ( 2,851) ( 37,984) ( 1,458) ( 45)
Losses (gains) on equity-method investments 35,112 12,554 ( 103,997) ( 3,207)
Provision for redemption of convertible bonds 2,042 - - -
Foreign exchange gains on convertible bonds ( 8,179) - - -
Amortization of bond issue costs 17,675 - - -
Deferred income tax assets ( 256,170) ( 168,447) ( 294,803) ( 9,090)
Prepaid pension costs ( 42,097) ( 24,260) ( 21,167) ( 653)
Net changes in operating assets and liabilities
Financial instruments at fair value through profit or loss ( 58,991) 136,555 19,786 610
Notes receivable ( 27,331) 40,157 55,872 1,723
Accounts receivable ( 5,826,625) ( 4,105,164) ( 625,888) ( 19,299)
Accounts receivable from related parties ( 342,567) ( 891,010) 774,915 23,895
Other current financial assets ( 6,667) ( 313,503) 84,446 2,604
Inventories ( 633,904) ( 146,338) ( 1,135,522) ( 35,014)
Prepayments ( 229,433) ( 1,406,858) 343,792 10,601
Other current assets 17,390 ( 32,776) ( 53,740) ( 1,657)
Notes and accounts payable 5,854,811 3,050,346 5,173,079 159,515
Income tax payable 522,709 1,141,854 755,677 23,302
Accrued expenses 342,540 1,135,322 2,929,700 90,339
Other current liabilities 838,408 605,960 2,385,612 73,562
Net cash provided by operating activities 12,596,157 24,876,295 39,781,172 1,226,678
CASH
F
LOWS
F
ROM INVESTING ACTIVITIES
Purchase of properties ( 601,915) ( 997,233) ( 1,201,063) ( 37,035)
Proceeds of the sales of properties 5,882 44,664 5,155 159
Acquisition of investments accounted for by the equity method - ( 478,933) ( 1,472,702) ( 45,412)
Acquisition of financial assets carried at cost - - ( 500,000) ( 15,418)
Acquisition of bond investments with no active market - - ( 33,030) ( 1,019)
Proceeds of the disposal of long-term investments 4,312 - - -
Increase in refundable deposits ( 29,356) ( 1,713) ( 56,446) ( 1,741)
Net cash used in investing activities ( 621,077) ( 1,433,215) ( 3,258,086) ( 100,466)
(
Continue
)


