HTC 2007 Annual Report Download - page 90
Download and view the complete annual report
Please find page 90 of the 2007 HTC annual report below. You can navigate through the pages in the report by either clicking on the pages listed below, or by using the keyword search tool below to find specific information within the annual report.-
 1
1 -
2
-
3
-
4
-
5
-
6
-
7
-
8
-
9
-
10
-
11
-
12
-
13
-
14
-
15
-
16
-
17
-
18
-
19
-
20
-
21
-
22
-
23
-
24
-
25
-
26
-
27
-
28
-
29
-
30
-
31
-
32
-
33
-
34
-
35
-
36
-
37
-
38
-
39
-
40
-
41
-
42
-
43
-
44
-
45
-
46
-
47
-
48
-
49
-
50
-
51
-
52
-
53
-
54
-
55
-
56
-
57
-
58
-
59
-
60
-
61
-
62
-
63
-
64
-
65
-
66
-
67
-
68
-
69
-
70
-
71
-
72
-
73
-
74
-
75
-
76
-
77
-
78
-
79
-
 80
80 -
 81
81 -
 82
82 -
 83
83 -
 84
84 -
 85
85 -
 86
86 -
 87
87 -
 88
88 -
 89
89 -
 90
90 -
 91
91 -
 92
92 -
 93
93 -
 94
94 -
 95
95 -
 96
96 -
 97
97 -
 98
98 -
 99
99 -
 100
100 -
101
-
102
-
103
-
104
-
105
-
106
-
107
-
108
-
109
-
110
-
111
-
112
-
113
-
114
-
115
-
116
-
117
-
118
-
119
-
120
-
121
-
122
-
123
-
124
-
125
-
126
-
127
-
128
 |
 |

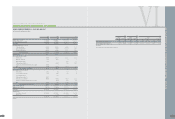
AN OVERVIEW OFTHE COMPANY'S FINANCIAL STATUS
175174
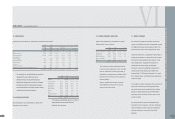
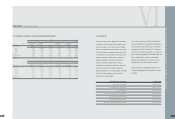
7. AVAILABLE-
F
OR-SALE
F
INANCIAL ASSETS
Available-for-sale financial assets as of December
31, 2005, 2006 and 2007 consisted of an investment
in VIA Technologies, Inc., as follows:
2005 2006 2007
NT$ NT$ NT$ US$(Note 3)
VIA Technologies, Inc. $ 836 $ 1,733 $ 784 $ 24
•The Co
m
pany
'
s original invest
m
ent in VIA Technologies,
Inc. was
N
T$1,971 thousand,
m
ade in
D
ece
m
ber 1999.
8. NOTES AND ACCOUNTS RECEIVABLE
Notes and accounts receivable as of December 31,
2005, 2006 and 2007 were as follows:
2005 2006 2007
NT$ NT$ NT$ US$(Note 3)
Notes receivable $ 99,087 $ 58,930 $ 3,532 $ 109
Accounts receivable 14,396,015 19,176,850 19,747,487 608,926
Accounts receivable -related parties
1,718 3,685 507 16
Less allowance for doubtful accounts
(8,910) ( 32,234) ( 277,809) ( 8,566)
$14,487,910 $19,207,231 $19,473,717 $ 600,485
>
F
orw
a
rd Ex
c
h
a
ng
e
Con
t
r
a
c
t
s
2005
Buy/Sell Currency Settlement Period/ Date Contract Amount
Forward exchange contracts Sell USD/NTD 2006.01.02-2006.01.27 US$ 167,000
Forward exchange contracts Sell EUR/USD 2006.01.02-2006.02.22 EUR
C
=79,000
Forward exchange contracts Sell GBP/USD 2006.01.25 GBP£ 3,000
2006
Buy/Sell Currency Settlement Period/ Date Contract Amount
Forward exchange contracts Sell USD/NTD 2007.01.05-2007.03.28 US$ 78,000
Forward exchange contracts Sell EUR/USD 2007.01.05-2007.03.09 EUR
C
=108,000
Forward exchange contracts Buy USD/JPY 2007.01.12-2007.03.09 US$ 11,000
Forward exchange contracts Sell GBP/USD 2007.01.05-2007.02.16 GBP£ 6,150
Forward exchange contracts Sell JPY/NTD 2007.01.12-2007.03.28 JP¥ 427,750
Forward exchange contracts Sell JPY/USD 2007.01.17-2007.03.28 JP¥ 810,626
2007
Buy/Sell Currency Settlement Period/ Date Contract Amount
Forward exchange contracts Sell USD/NTD 2008.01.04-2008.01.30 US$ 63,000
Forward exchange contracts Sell EUR/USD 2008.01.09-2008.03.05 EUR
C
=201,500
Forward exchange contracts Buy USD/CAD 2008.01.11-2008.02.22 US$ 5,146
Forward exchange contracts Sell GBP/USD 2008.01.11-2008.01.30 GBP£ 3,725
Forward exchange contracts Sell JPY/NTD 2008.01.09 JP¥ 425,000
•
N
et loss on derivative financial instru
m
ents in 2007 was
N
T$679,996 thousand
(
U
S
$20,968 thousand
)
, consisting of realized
settle
m
ent losses of
N
T$583,740 thousand
(
U
S
$18,000 thousand
)
and valuation losses of
N
T$96,256 thousand
(
U
S
$2,968 thousand
)
VI
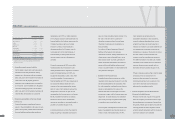
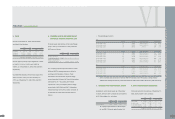
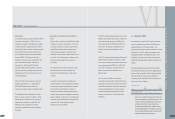
5. CASH
Cash as of December 31, 2005, 2006 and 2007
consisted of the following:
2005 2006 2007
NT$ NT$ NT$ US$(Note 3)
Cash on hand $ 1,104 $ 1,505 $ 2,405 $ 74
Cash in banks 6,707,222 4,499,913 9,908,345 305,530
Time deposits 9,716,900 30,468,400 46,579,435 1,436,307
$16,425,226 $34,969,818 $56,490,185 $1,741,911
On time deposits, interest rates ranged from 1.315%
to 1.840%, 1.610% to 2.145% and 1.809% to
4.400%, as of December 31, 2005, 2006 and 2007,
respectively.
On preferential deposits, interest rates ranged from
2.00% to 4.45%, 2.30% to 5.25% and 3.05% to
4.15% as of December 31, 2005, 2006 and 2007,
respectively.
6.
F
INANCIAL ASSETS AND LIABILITIES AT
F
AIR VALUE THROUGH PRO
F
IT OR LOSS
Financial assets and liabilities at fair value through
profit or loss as of December 31, 2005, 2006 and
2007 were as follows:
2005 2006 2007
NT$ NT$ NT$ US$(Note 3)
Derivatives - financial assets
Forward exchange contracts $ 60,085 $ - $ - $ -
Derivatives - financial liabilities
Forward exchange contracts $ - $ 76,470 $ 96,256 $ 2,968
The Company had derivative transactions in 2005,
2006 and 2007 to manage exposures related to
exchange rate fluctuations. However, these
transactions did not meet the criteria for hedge
accounting under Statement of Financial Accounting
Standards No. 34 - "Accounting for Financial
Instruments." Thus, the Company had no hedge
accounting in 2005, 2006 and 2007. Outstanding
forward exchange and currency option contracts as
of December 31, 2005, 2006 and 2007 were as
follows:
FINANCEI CONSOLIDATED REPORT
l