HSBC 2005 Annual Report Download - page 95
Download and view the complete annual report
Please find page 95 of the 2005 HSBC annual report below. You can navigate through the pages in the report by either clicking on the pages listed below, or by using the keyword search tool below to find specific information within the annual report.
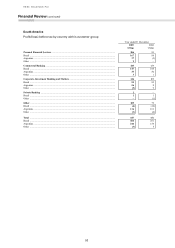
93
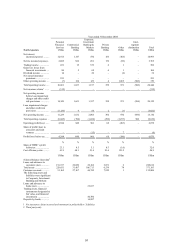
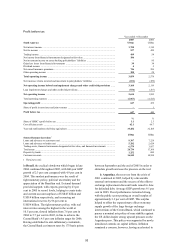
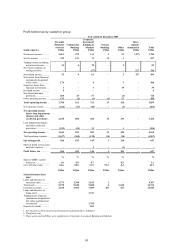
Profit before tax
Year ended 31 December
2005 2004
South America US$m US$m
Net interest income ......................................................................................................................... 1,750 1,310
Net fee income ............................................................................................................................... 537 459
Trading income .............................................................................................................................. 409 54
Net income from financial instruments designated at fair value ..................................................... 186 –
Net investment income on assets backing policyholders’ liabilities ............................................... –95
Gains less losses from financial investments .................................................................................. 39 34
Dividend income ............................................................................................................................ 42
Net earned insurance premiums ...................................................................................................... 746 596
Other operating income .................................................................................................................. 188 28
Total operating income ................................................................................................................ 3,859 2,578
Net insurance claims incurred and movement in policyholders’ liabilities ..................................... (691) (459)
Net operating income before loan impairment charges and other credit risk provisions ....... 3,168 2,119
Loan impairment charges and other credit risk provisions .............................................................. (554) (267)
Net operating income ................................................................................................................... 2,614 1,852
Total operating expenses ................................................................................................................ (1,967) (1,413)
Operating profit ............................................................................................................................ 647 439
Share of profit in associates and joint ventures ...............................................................................–1
Profit before tax ............................................................................................................................ 647 440
%%
Share of HSBC’s profit before tax .................................................................................................. 3.1 2.3
Cost efficiency ratio ....................................................................................................................... 62.1 66.7
Year-end staff numbers (full-time equivalent) ................................................................................ 33,282 32,108
US$m US$m
Selected balance sheet data1
Loans and advances to customers (net) ........................................................................................... 9,307 7,228
Loans and advances to banks (net) ................................................................................................. 5,282 2,624
Trading assets, financial instruments designated at fair value, and financial investments .............. 6,579 3,857
Total assets ..................................................................................................................................... 24,734 17,368
Deposits by banks ........................................................................................................................... 1,252 680
Customer accounts ......................................................................................................................... 16,545 10,958
1Third party only.
In Brazil, the cyclical slowdown which began in late
2004 continued throughout 2005, with full-year GDP
growth of 2.3 per cent compared with 4.9 per cent in
2004. This modest performance was the result of
tight monetary policy, political uncertainty and the
appreciation of the Brazilian real. External demand
provided support, with exports growing by 23 per
cent in 2005 to record levels, helping to create trade
and current account surpluses of US$45 billion and
US$14 billion respectively, and increasing net
international reserves by 96 per cent to
US$54 billion. The tight monetary policy, with real
interest rates among the highest in the world at
10.5 per cent, slowed inflation from 7.6 per cent in
2004 to 5.7 per cent in 2005, in line to achieve the
Central Bank’s 4.5 per cent inflation target for 2006.
Having established its anti-inflationary credentials,
the Central Bank cut interest rates by 175 basis points
between September and the end of 2005 in order to
stimulate growth and ease the pressure on the real.
In Argentina, the recovery from the crisis of
2001 continued in 2005, helped by a favourable
external environment and the success of the offer to
exchange replacement discount bonds issued in June
for defaulted debt. Average GDP growth was 9.1 per
cent in 2005. Fiscal performance remained strong,
with the public sector posting an overall surplus of
approximately 3.3 per cent of GDP. This surplus
helped to offset the expansionary effect on money
supply growth of the large foreign exchange
interventions of the Central Bank, which continued to
pursue a nominal rate policy of near stability against
the US dollar despite strong upward pressure on the
Argentine peso. This policy was supported by newly
introduced controls on capital inflows. Inflation
remained a concern, however, having accelerated to


