HSBC 2005 Annual Report Download - page 125
Download and view the complete annual report
Please find page 125 of the 2005 HSBC annual report below. You can navigate through the pages in the report by either clicking on the pages listed below, or by using the keyword search tool below to find specific information within the annual report.-
 1
1 -
2
-
3
-
4
-
5
-
6
-
7
-
8
-
9
-
10
-
11
-
12
-
13
-
14
-
15
-
16
-
17
-
18
-
19
-
20
-
21
-
22
-
23
-
24
-
25
-
26
-
27
-
28
-
29
-
30
-
31
-
32
-
33
-
34
-
35
-
36
-
37
-
38
-
39
-
40
-
41
-
42
-
43
-
44
-
45
-
46
-
47
-
48
-
49
-
50
-
51
-
52
-
53
-
54
-
55
-
56
-
57
-
58
-
59
-
60
-
61
-
62
-
63
-
64
-
65
-
66
-
67
-
68
-
69
-
70
-
71
-
72
-
73
-
74
-
75
-
76
-
77
-
78
-
79
-
80
-
81
-
82
-
83
-
84
-
85
-
86
-
87
-
88
-
89
-
90
-
91
-
92
-
93
-
94
-
95
-
96
-
97
-
98
-
99
-
100
-
101
-
102
-
103
-
104
-
105
-
106
-
107
-
108
-
109
-
110
-
111
-
112
-
113
-
114
-
 115
115 -
 116
116 -
 117
117 -
 118
118 -
 119
119 -
 120
120 -
 121
121 -
 122
122 -
 123
123 -
 124
124 -
 125
125 -
 126
126 -
 127
127 -
 128
128 -
 129
129 -
 130
130 -
 131
131 -
 132
132 -
 133
133 -
 134
134 -
 135
135 -
136
-
137
-
138
-
139
-
140
-
141
-
142
-
143
-
144
-
145
-
146
-
147
-
148
-
149
-
150
-
151
-
152
-
153
-
154
-
155
-
156
-
157
-
158
-
159
-
160
-
161
-
162
-
163
-
164
-
165
-
166
-
167
-
168
-
169
-
170
-
171
-
172
-
173
-
174
-
175
-
176
-
177
-
178
-
179
-
180
-
181
-
182
-
183
-
184
-
185
-
186
-
187
-
188
-
189
-
190
-
191
-
192
-
193
-
194
-
195
-
196
-
197
-
198
-
199
-
200
-
201
-
202
-
203
-
204
-
205
-
206
-
207
-
208
-
209
-
210
-
211
-
212
-
213
-
214
-
215
-
216
-
217
-
218
-
219
-
220
-
221
-
222
-
223
-
224
-
225
-
226
-
227
-
228
-
229
-
230
-
231
-
232
-
233
-
234
-
235
-
236
-
237
-
238
-
239
-
240
-
241
-
242
-
243
-
244
-
245
-
246
-
247
-
248
-
249
-
250
-
251
-
252
-
253
-
254
-
255
-
256
-
257
-
258
-
259
-
260
-
261
-
262
-
263
-
264
-
265
-
266
-
267
-
268
-
269
-
270
-
271
-
272
-
273
-
274
-
275
-
276
-
277
-
278
-
279
-
280
-
281
-
282
-
283
-
284
-
285
-
286
-
287
-
288
-
289
-
290
-
291
-
292
-
293
-
294
-
295
-
296
-
297
-
298
-
299
-
300
-
301
-
302
-
303
-
304
-
305
-
306
-
307
-
308
-
309
-
310
-
311
-
312
-
313
-
314
-
315
-
316
-
317
-
318
-
319
-
320
-
321
-
322
-
323
-
324
-
325
-
326
-
327
-
328
-
329
-
330
-
331
-
332
-
333
-
334
-
335
-
336
-
337
-
338
-
339
-
340
-
341
-
342
-
343
-
344
-
345
-
346
-
347
-
348
-
349
-
350
-
351
-
352
-
353
-
354
-
355
-
356
-
357
-
358
-
359
-
360
-
361
-
362
-
363
-
364
-
365
-
366
-
367
-
368
-
369
-
370
-
371
-
372
-
373
-
374
-
375
-
376
-
377
-
378
-
379
-
380
-
381
-
382
-
383
-
384
-
385
-
386
-
387
-
388
-
389
-
390
-
391
-
392
-
393
-
394
-
395
-
396
-
397
-
398
-
399
-
400
-
401
-
402
-
403
-
404
-
405
-
406
-
407
-
408
-
409
-
410
-
411
-
412
-
413
-
414
-
415
-
416
-
417
-
418
-
419
-
420
-
421
-
422
-
423
-
424
 |
 |

123
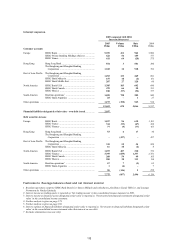
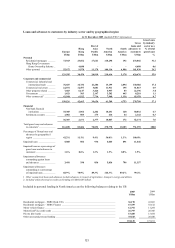
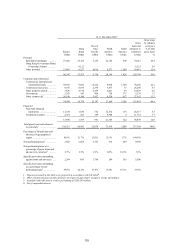
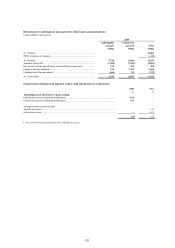
At 31 December 20031
Europe
Hong
Kong
Rest of
Asia-
Pacific
North
America
South
America
Gross
loans and
advances to
customers
Gross loans
by industry
sector as a
% of total
gross loans
US$m US$m US$m US$m US$m US$m %
Personal
Residential mortgages .............. 51,721 23,664 12,101 77,754 224 165,464 30.4
Hong Kong Government Home
Ownership Scheme ............. – 6,290 – – – 6,290 1.2
Other personal ......................... 42,041 7,420 7,135 75,173 2,376 134,145 24.7
93,762 37,374 19,236 152,927 2,600 305,899 56.3
Corporate and commercial
Commercial, industrial and
international trade ............... 49,468 10,966 14,892 8,907 1,435 85,668 15.7
Commercial real estate ............ 15,517 8,548 3,149 7,785 89 35,088 6.5
Other property-related ............. 5,416 5,075 2,597 3,994 58 17,140 3.2
Government ............................. 2,462 927 1,450 4,104 647 9,590 1.8
Other commercial1.................... 24,239 6,754 5,735 6,619 683 44,030 8.1
97,102 32,270 27,823 31,409 2,912 191,516 35.3
Financial
Non-bank financial
institutions ........................... 21,226 4,921 2,027 8,839 78 37,091 6.8
Settlement accounts ................. 3,068 556 188 4,767 15 8,594 1.6
24,294 5,477 2,215 13,606 93 45,685 8.4
Total gross loans and advances
to customers3 ........................... 215,158 75,121 49,274 197,942 5,605 543,100 100.0
Percentage of Group loans and
advances by geographical
region ...................................... 39.7% 13.8% 9.1% 36.4% 1.0% 100.0%
Non-performing loans5 ................. 5,701 1,671 1,538 5,444 696 15,050
Non-performing loans as a
percentage of gross loans and
advances to customers4 ............ 2.6% 2.2% 3.1% 2.8% 12.4% 2.8%
Specific provisions outstanding
against loans and advances5 ..... 3,554 629 981 5,184 530 10,878
Specific provisions outstanding
as a percentage of non-
performing loans5 .................... 62.3% 37.6% 63.8% 95.2% 76.1% 72.3%
1Figures presented in this table were prepared in accordance with UK GAAP.
2Other commercial loans and advances include advances in respect of agriculture, transport, energy and utilities.
3Included within this total is credit card lending of US$48,634 million.
4Net of suspended interest.
5Included in North America are non-performing loans of US$4,380 million and specific provisions of US$4,448 million in HSBC
Finance; excluding HSBC Finance, specific provisions outstanding as a percentage of non-performing loans was 69.2 per cent.