HSBC 2005 Annual Report Download - page 402
Download and view the complete annual report
Please find page 402 of the 2005 HSBC annual report below. You can navigate through the pages in the report by either clicking on the pages listed below, or by using the keyword search tool below to find specific information within the annual report.-
 1
1 -
2
-
3
-
4
-
5
-
6
-
7
-
8
-
9
-
10
-
11
-
12
-
13
-
14
-
15
-
16
-
17
-
18
-
19
-
20
-
21
-
22
-
23
-
24
-
25
-
26
-
27
-
28
-
29
-
30
-
31
-
32
-
33
-
34
-
35
-
36
-
37
-
38
-
39
-
40
-
41
-
42
-
43
-
44
-
45
-
46
-
47
-
48
-
49
-
50
-
51
-
52
-
53
-
54
-
55
-
56
-
57
-
58
-
59
-
60
-
61
-
62
-
63
-
64
-
65
-
66
-
67
-
68
-
69
-
70
-
71
-
72
-
73
-
74
-
75
-
76
-
77
-
78
-
79
-
80
-
81
-
82
-
83
-
84
-
85
-
86
-
87
-
88
-
89
-
90
-
91
-
92
-
93
-
94
-
95
-
96
-
97
-
98
-
99
-
100
-
101
-
102
-
103
-
104
-
105
-
106
-
107
-
108
-
109
-
110
-
111
-
112
-
113
-
114
-
115
-
116
-
117
-
118
-
119
-
120
-
121
-
122
-
123
-
124
-
125
-
126
-
127
-
128
-
129
-
130
-
131
-
132
-
133
-
134
-
135
-
136
-
137
-
138
-
139
-
140
-
141
-
142
-
143
-
144
-
145
-
146
-
147
-
148
-
149
-
150
-
151
-
152
-
153
-
154
-
155
-
156
-
157
-
158
-
159
-
160
-
161
-
162
-
163
-
164
-
165
-
166
-
167
-
168
-
169
-
170
-
171
-
172
-
173
-
174
-
175
-
176
-
177
-
178
-
179
-
180
-
181
-
182
-
183
-
184
-
185
-
186
-
187
-
188
-
189
-
190
-
191
-
192
-
193
-
194
-
195
-
196
-
197
-
198
-
199
-
200
-
201
-
202
-
203
-
204
-
205
-
206
-
207
-
208
-
209
-
210
-
211
-
212
-
213
-
214
-
215
-
216
-
217
-
218
-
219
-
220
-
221
-
222
-
223
-
224
-
225
-
226
-
227
-
228
-
229
-
230
-
231
-
232
-
233
-
234
-
235
-
236
-
237
-
238
-
239
-
240
-
241
-
242
-
243
-
244
-
245
-
246
-
247
-
248
-
249
-
250
-
251
-
252
-
253
-
254
-
255
-
256
-
257
-
258
-
259
-
260
-
261
-
262
-
263
-
264
-
265
-
266
-
267
-
268
-
269
-
270
-
271
-
272
-
273
-
274
-
275
-
276
-
277
-
278
-
279
-
280
-
281
-
282
-
283
-
284
-
285
-
286
-
287
-
288
-
289
-
290
-
291
-
292
-
293
-
294
-
295
-
296
-
297
-
298
-
299
-
300
-
301
-
302
-
303
-
304
-
305
-
306
-
307
-
308
-
309
-
310
-
311
-
312
-
313
-
314
-
315
-
316
-
317
-
318
-
319
-
320
-
321
-
322
-
323
-
324
-
325
-
326
-
327
-
328
-
329
-
330
-
331
-
332
-
333
-
334
-
335
-
336
-
337
-
338
-
339
-
340
-
341
-
342
-
343
-
344
-
345
-
346
-
347
-
348
-
349
-
350
-
351
-
352
-
353
-
354
-
355
-
356
-
357
-
358
-
359
-
360
-
361
-
362
-
363
-
364
-
365
-
366
-
367
-
368
-
369
-
370
-
371
-
372
-
373
-
374
-
375
-
376
-
377
-
378
-
379
-
380
-
381
-
382
-
383
-
384
-
385
-
386
-
387
-
388
-
389
-
390
-
391
-
 392
392 -
 393
393 -
 394
394 -
 395
395 -
 396
396 -
 397
397 -
 398
398 -
 399
399 -
 400
400 -
 401
401 -
 402
402 -
 403
403 -
 404
404 -
 405
405 -
 406
406 -
 407
407 -
 408
408 -
 409
409 -
 410
410 -
 411
411 -
 412
412 -
413
-
414
-
415
-
416
-
417
-
418
-
419
-
420
-
421
-
422
-
423
-
424
 |
 |

HSBC HOLDINGS PLC
Notes on the Financial Statements (continued)
400
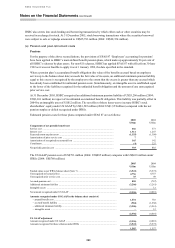
does not recognise a gain in a secured financing transaction. At 31 December 2005, secured financings of
US$18.2 billion included in long-term debt were secured by US$25.6 billion of customer loans.
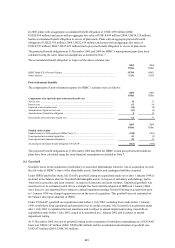
Prior to the third quarter of 2004, HSBC sold MasterCard and Visa private label, personal non-credit card and
vehicle finance loans in various securitisation transactions. HSBC continues to service and receive servicing fees
on the outstanding balance of these securitised loans and retains rights to future cash flows arising from the loans
after the investors receive their contractual return. HSBC has also, in certain cases, retained other subordinated
interests in these securitisations. These transactions result in the recording of interest-only strip receivables,
which represent the value of the future residual cash flows from securitised loans. The investors and the
securitisation trusts have only limited recourse to HSBC assets for failure of debtors to pay. That recourse is
limited to HSBC’s rights to future cash flows and any subordinated interest retained. Servicing assets and
liabilities are not recognised in conjunction with securitisations since HSBC receives adequate compensation
relative to current market rates to service the loans sold.
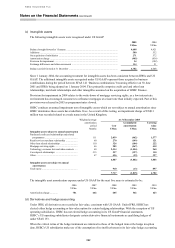
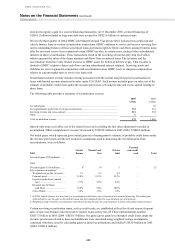
Securitisation-related revenue includes income associated with the current and prior period securitisation of
loans with limited recourse structured as sales under US GAAP. Such income includes gains on sales, net of the
estimate of probable credit losses under the recourse provisions, servicing income and excess spread relating to
those loans.
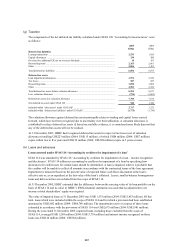
The following table provides a summary of securitisation revenue:
2005 2004
US$m US$m
Net initial gains ....................................................................................................................... –25
Net replenishment gains from revolving securitisations .......................................................... 154 414
Servicing revenue and excess spread ....................................................................................... 212 569
Other ....................................................................................................................................... 6–
Total securitisation revenue ..................................................................................................... 372 1,008
Interest-only strip receivables, net of the related losses and excluding the fair value adjustment recorded in
accumulated ‘Other comprehensive income’ decreased by US$258 million in 2005 (2004: US$466 million).
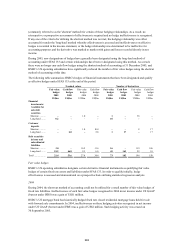
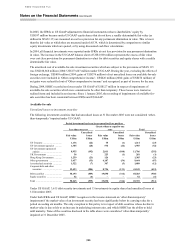
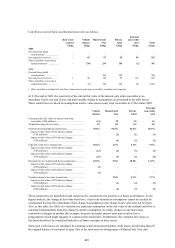
Net initial gains, which represent gross initial gains net of management’s estimate of probable credit losses under
the recourse provisions, and the key economic assumptions used in measuring the net initial gains from
securitisations, were as follows:
2005
Vehicle
finance
MasterCard/
Visa
Private
label
Personal
non-credit
card Total
Net initial gains (US$ millions) ........ –––––
2004
Net initial gains (US$ millions) ........ 61145–25
Key economic assumptions2
Weighted average life (in years) ... 2.1 0.3 0.4 –
Payment speed .............................. 35.0% 93.5% 93.5% –
Expected credit losses (annual
rate) .......................................... 5.7% 4.9% 4.8% –
Discount rate for future
cash flows ................................ 10.0% 9.0% 10.0% –
Cost of funds ................................ 3.0% 1.5% 1.4% –
1In 2004, vehicle finance was involved in a securitisation which later was restructured as a secured financing. The initial gain
reflected above was the gain on the initial transaction that remained after the securitisation was restructured.
2Weighted average rates for securitisations entered into during the year for securitisations of loans with similar characteristics.
Certain revolving securitisation trusts, such as credit cards, are established at fixed levels and require frequent
sales of new loan balances into the trusts to replace loans as they run off. These replenishments totalled
US$17.5 billion in 2005 (2004: US$30.3 billion). Net gains (gross gains less estimated credit losses under the
recourse provisions) related to these replenishments were calculated using weighted average assumptions
consistent with those used for calculating gains on initial securitisations, and totalled US$154 million in 2005
(2004: US$414 million).