HSBC 2005 Annual Report Download - page 158
Download and view the complete annual report
Please find page 158 of the 2005 HSBC annual report below. You can navigate through the pages in the report by either clicking on the pages listed below, or by using the keyword search tool below to find specific information within the annual report.-
 1
1 -
2
-
3
-
4
-
5
-
6
-
7
-
8
-
9
-
10
-
11
-
12
-
13
-
14
-
15
-
16
-
17
-
18
-
19
-
20
-
21
-
22
-
23
-
24
-
25
-
26
-
27
-
28
-
29
-
30
-
31
-
32
-
33
-
34
-
35
-
36
-
37
-
38
-
39
-
40
-
41
-
42
-
43
-
44
-
45
-
46
-
47
-
48
-
49
-
50
-
51
-
52
-
53
-
54
-
55
-
56
-
57
-
58
-
59
-
60
-
61
-
62
-
63
-
64
-
65
-
66
-
67
-
68
-
69
-
70
-
71
-
72
-
73
-
74
-
75
-
76
-
77
-
78
-
79
-
80
-
81
-
82
-
83
-
84
-
85
-
86
-
87
-
88
-
89
-
90
-
91
-
92
-
93
-
94
-
95
-
96
-
97
-
98
-
99
-
100
-
101
-
102
-
103
-
104
-
105
-
106
-
107
-
108
-
109
-
110
-
111
-
112
-
113
-
114
-
115
-
116
-
117
-
118
-
119
-
120
-
121
-
122
-
123
-
124
-
125
-
126
-
127
-
128
-
129
-
130
-
131
-
132
-
133
-
134
-
135
-
136
-
137
-
138
-
139
-
140
-
141
-
142
-
143
-
144
-
145
-
146
-
147
-
 148
148 -
 149
149 -
 150
150 -
 151
151 -
 152
152 -
 153
153 -
 154
154 -
 155
155 -
 156
156 -
 157
157 -
 158
158 -
 159
159 -
 160
160 -
 161
161 -
 162
162 -
 163
163 -
 164
164 -
 165
165 -
 166
166 -
 167
167 -
 168
168 -
169
-
170
-
171
-
172
-
173
-
174
-
175
-
176
-
177
-
178
-
179
-
180
-
181
-
182
-
183
-
184
-
185
-
186
-
187
-
188
-
189
-
190
-
191
-
192
-
193
-
194
-
195
-
196
-
197
-
198
-
199
-
200
-
201
-
202
-
203
-
204
-
205
-
206
-
207
-
208
-
209
-
210
-
211
-
212
-
213
-
214
-
215
-
216
-
217
-
218
-
219
-
220
-
221
-
222
-
223
-
224
-
225
-
226
-
227
-
228
-
229
-
230
-
231
-
232
-
233
-
234
-
235
-
236
-
237
-
238
-
239
-
240
-
241
-
242
-
243
-
244
-
245
-
246
-
247
-
248
-
249
-
250
-
251
-
252
-
253
-
254
-
255
-
256
-
257
-
258
-
259
-
260
-
261
-
262
-
263
-
264
-
265
-
266
-
267
-
268
-
269
-
270
-
271
-
272
-
273
-
274
-
275
-
276
-
277
-
278
-
279
-
280
-
281
-
282
-
283
-
284
-
285
-
286
-
287
-
288
-
289
-
290
-
291
-
292
-
293
-
294
-
295
-
296
-
297
-
298
-
299
-
300
-
301
-
302
-
303
-
304
-
305
-
306
-
307
-
308
-
309
-
310
-
311
-
312
-
313
-
314
-
315
-
316
-
317
-
318
-
319
-
320
-
321
-
322
-
323
-
324
-
325
-
326
-
327
-
328
-
329
-
330
-
331
-
332
-
333
-
334
-
335
-
336
-
337
-
338
-
339
-
340
-
341
-
342
-
343
-
344
-
345
-
346
-
347
-
348
-
349
-
350
-
351
-
352
-
353
-
354
-
355
-
356
-
357
-
358
-
359
-
360
-
361
-
362
-
363
-
364
-
365
-
366
-
367
-
368
-
369
-
370
-
371
-
372
-
373
-
374
-
375
-
376
-
377
-
378
-
379
-
380
-
381
-
382
-
383
-
384
-
385
-
386
-
387
-
388
-
389
-
390
-
391
-
392
-
393
-
394
-
395
-
396
-
397
-
398
-
399
-
400
-
401
-
402
-
403
-
404
-
405
-
406
-
407
-
408
-
409
-
410
-
411
-
412
-
413
-
414
-
415
-
416
-
417
-
418
-
419
-
420
-
421
-
422
-
423
-
424
 |
 |

HSBC HOLDINGS PLC
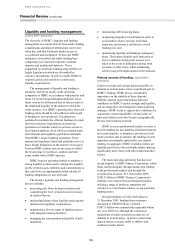
Financial Review (continued)
156
Non-trading (Audited IFRS 7 information)
The principal objective of market risk management
of non-trading portfolios is to optimise net interest
income.
Market risk in non-trading portfolios arises
principally from mismatches between the future
yield on assets and their funding cost, as a result of
interest rate changes. Analysis of this risk is
complicated by having to make assumptions on
optionality in certain product areas, for example,
mortgage prepayments, and from behavioural
assumptions regarding the economic duration of
liabilities which are contractually repayable on
demand, for example, current accounts. The
prospective change in future net interest income
from non-trading portfolios will be reflected in the
current realisable value of these positions, should
they be sold or closed prior to maturity. In order to
manage this risk optimally, market risk in non-
trading portfolios is transferred to Global Markets or
to separate books managed under the supervision of
the local ALCO.
The transfer of market risk to books managed by
Global Markets or supervised by ALCO is usually
achieved by a series of internal deals between the
business units and these books. When the
behavioural characteristics of a product differ from
its contractual characteristics, the behavioural
characteristics are assessed to determine the true
underlying interest rate risk. Local ALCOs regularly
monitor all such behavioural assumptions and
interest rate risk positions, to ensure they comply
with interest rate risk limits established by the Group
Management Board.
As noted above, in certain cases, the non-linear
characteristics of products cannot be adequately
captured by the risk transfer process. For example,
both the flow from customer deposit accounts to
alternative investment products and the precise
prepayment speeds of mortgages will vary at
different interest rate levels. In such circumstances,
simulation modelling is used to identify the impact
of varying scenarios on valuations and net interest
income.
Once market risk has been consolidated in
Global Markets or ALCO-managed books, the net
exposure is typically managed through the use of
interest rate swaps within agreed limits.
The principal non-trading risks which are not
included in VAR for Global Markets (see ‘Value at
risk’ above) are detailed below.
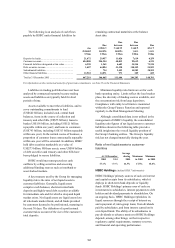
Market risk within HSBC Finance primarily
arises from mismatches between future
behaviouralised asset yields and their funding costs.
This mismatch mainly comes from the fact that asset
yields are predominantly fixed and relatively
insensitive to market movements in interest rates,
whereas the related wholesale funding and its
associated derivatives are more sensitive to such
movements. This non-trading risk is principally
managed by controlling the sensitivity of projected
net interest income under varying interest rate
scenarios: see ‘Net interest income’ below.
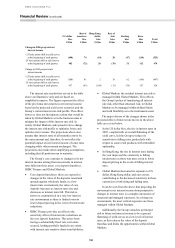
VAR limits are set to control the total market
risk exposure of HSBC Finance. The VAR as at
31 December 2005 was US$13.5 million (2005
average: US$13.4 million; 2005 minimum:
US$6.2 million; 2005 maximum: US$41.6 million),
compared with US$9.1 million at 31 December 2004
(2004 average: US$16.1 million; 2004 minimum:
US$4.1 million; 2004 maximum: US$31.9 million).
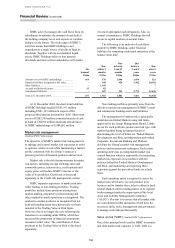
Market risk arising in the prime residential
mortgage business of HSBC Bank USA is primarily
managed by a specialist function within the business,
under guidelines established by HSBC Bank USA’s
ALCO. A range of risk management tools is applied
to hedge the sensitivity arising from movements in
interest rates. The key element of market risk within
the US prime mortgage business relates to the
prepayment options embedded in US mortgages,
which affect the sensitivity of the value of mortgage
servicing rights (‘MSRs’) to interest rate movements
and the net interest margin on mortgage assets.
MSRs represent the economic value of the right to
receive fees for performing specified residential
mortgage servicing activities. They are sensitive to
interest rate movements because lower rates
accelerate the prepayment speed of the underlying
mortgages and therefore reduce the value of the
MSRs. The reverse is true for rising rates. HSBC
uses a combination of interest rate-sensitive
derivatives and debt securities to help protect the
economic value of MSRs. An accounting asymmetry
can arise in this area because the derivatives used to
hedge the economic exposure arising from MSRs are
always measured at fair value, but the MSRs
themselves are measured for accounting purposes at
the lower of amortised cost and valuation. It is,
therefore, possible for an economically hedged
position not to be shown as such in the accounts,
when the hedge shows a loss but the MSR cannot be
revalued above cost to reflect the related profit.
HSBC’s policy again is to hedge the economic risk.
VAR limits are set to control the exposure to
MSRs and MSR hedges. The VAR on MSRs and
MSR hedges at 31 December 2005 was
US$3.9 million (2005 average: US$3.2 million; 2005
minimum: US$2.4 million; 2005 maximum: