HSBC 2005 Annual Report Download - page 137
Download and view the complete annual report
Please find page 137 of the 2005 HSBC annual report below. You can navigate through the pages in the report by either clicking on the pages listed below, or by using the keyword search tool below to find specific information within the annual report.-
 1
1 -
2
-
3
-
4
-
5
-
6
-
7
-
8
-
9
-
10
-
11
-
12
-
13
-
14
-
15
-
16
-
17
-
18
-
19
-
20
-
21
-
22
-
23
-
24
-
25
-
26
-
27
-
28
-
29
-
30
-
31
-
32
-
33
-
34
-
35
-
36
-
37
-
38
-
39
-
40
-
41
-
42
-
43
-
44
-
45
-
46
-
47
-
48
-
49
-
50
-
51
-
52
-
53
-
54
-
55
-
56
-
57
-
58
-
59
-
60
-
61
-
62
-
63
-
64
-
65
-
66
-
67
-
68
-
69
-
70
-
71
-
72
-
73
-
74
-
75
-
76
-
77
-
78
-
79
-
80
-
81
-
82
-
83
-
84
-
85
-
86
-
87
-
88
-
89
-
90
-
91
-
92
-
93
-
94
-
95
-
96
-
97
-
98
-
99
-
100
-
101
-
102
-
103
-
104
-
105
-
106
-
107
-
108
-
109
-
110
-
111
-
112
-
113
-
114
-
115
-
116
-
117
-
118
-
119
-
120
-
121
-
122
-
123
-
124
-
125
-
126
-
 127
127 -
 128
128 -
 129
129 -
 130
130 -
 131
131 -
 132
132 -
 133
133 -
 134
134 -
 135
135 -
 136
136 -
 137
137 -
 138
138 -
 139
139 -
 140
140 -
 141
141 -
 142
142 -
 143
143 -
 144
144 -
 145
145 -
 146
146 -
 147
147 -
148
-
149
-
150
-
151
-
152
-
153
-
154
-
155
-
156
-
157
-
158
-
159
-
160
-
161
-
162
-
163
-
164
-
165
-
166
-
167
-
168
-
169
-
170
-
171
-
172
-
173
-
174
-
175
-
176
-
177
-
178
-
179
-
180
-
181
-
182
-
183
-
184
-
185
-
186
-
187
-
188
-
189
-
190
-
191
-
192
-
193
-
194
-
195
-
196
-
197
-
198
-
199
-
200
-
201
-
202
-
203
-
204
-
205
-
206
-
207
-
208
-
209
-
210
-
211
-
212
-
213
-
214
-
215
-
216
-
217
-
218
-
219
-
220
-
221
-
222
-
223
-
224
-
225
-
226
-
227
-
228
-
229
-
230
-
231
-
232
-
233
-
234
-
235
-
236
-
237
-
238
-
239
-
240
-
241
-
242
-
243
-
244
-
245
-
246
-
247
-
248
-
249
-
250
-
251
-
252
-
253
-
254
-
255
-
256
-
257
-
258
-
259
-
260
-
261
-
262
-
263
-
264
-
265
-
266
-
267
-
268
-
269
-
270
-
271
-
272
-
273
-
274
-
275
-
276
-
277
-
278
-
279
-
280
-
281
-
282
-
283
-
284
-
285
-
286
-
287
-
288
-
289
-
290
-
291
-
292
-
293
-
294
-
295
-
296
-
297
-
298
-
299
-
300
-
301
-
302
-
303
-
304
-
305
-
306
-
307
-
308
-
309
-
310
-
311
-
312
-
313
-
314
-
315
-
316
-
317
-
318
-
319
-
320
-
321
-
322
-
323
-
324
-
325
-
326
-
327
-
328
-
329
-
330
-
331
-
332
-
333
-
334
-
335
-
336
-
337
-
338
-
339
-
340
-
341
-
342
-
343
-
344
-
345
-
346
-
347
-
348
-
349
-
350
-
351
-
352
-
353
-
354
-
355
-
356
-
357
-
358
-
359
-
360
-
361
-
362
-
363
-
364
-
365
-
366
-
367
-
368
-
369
-
370
-
371
-
372
-
373
-
374
-
375
-
376
-
377
-
378
-
379
-
380
-
381
-
382
-
383
-
384
-
385
-
386
-
387
-
388
-
389
-
390
-
391
-
392
-
393
-
394
-
395
-
396
-
397
-
398
-
399
-
400
-
401
-
402
-
403
-
404
-
405
-
406
-
407
-
408
-
409
-
410
-
411
-
412
-
413
-
414
-
415
-
416
-
417
-
418
-
419
-
420
-
421
-
422
-
423
-
424
 |
 |

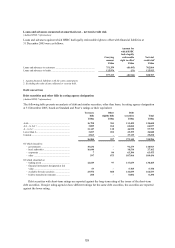
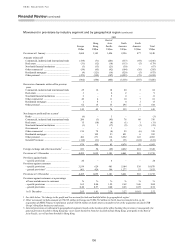
135
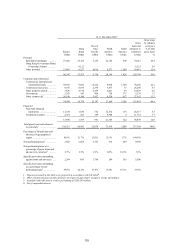
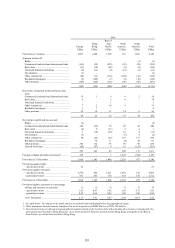
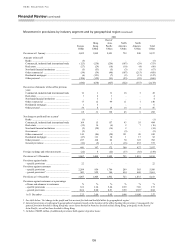
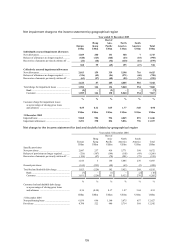
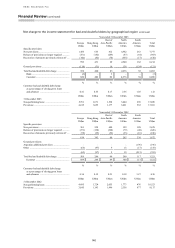
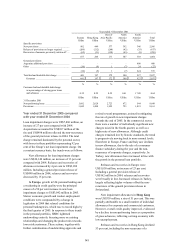
Movement in provisions by industry segment and by geographical region
2004
Europe
Hong
Kong
Rest of
Asia-
Pacific
North
America
South
America Total
US$m US$m US$m US$m US$m US$m
Provisions at 1 January ....................................... 4,435 1,055 1,181 6,461 583 13,715
IFRSs transition adjustment at 1 January ............ (2) (34) (21) – (1) (58)
Amounts written off
Commercial, industrial and international trade (298) (35) (164) (73) (53) (623)
Real estate ....................................................... (30) (55) (17) (3) (1) (106)
Non-bank financial institutions ....................... (14) (2) (1) (3) – (20)
Other commercial ........................................... (209) (33) (42) (204) (10) (498)
Residential mortgages ..................................... (10) (52) (8) (488) (3) (561)
Other personal ................................................. (770) (125) (171) (5,639) (331) (7,036)
(1,331) (302) (403) (6,410) (398) (8,844)
Recoveries of amounts written off in previous
years
Commercial, industrial and international trade 27 10 4 73 4 118
Real estate ....................................................... 3 – 10 4 – 17
Non-bank financial institutions ....................... 3 – – – – 3
Other commercial ........................................... 5 3 14 34 29 85
Residential mortgages ..................................... 1 12 1 17 – 31
Other personal ................................................. 97 22 41 453 46 659
136 47 70 581 79 913
Net charge to profit and loss account1
Banks .............................................................. (7) – (1) – (2) (10)
Commercial, industrial and international trade 180 (56) 52 (44) 47 179
Real estate ....................................................... 21 (15) (28) (1) 1 (22)
Non-bank financial institutions ....................... 18 (3) (1) 1 – 15
Governments ................................................... – – – 1 – 1
Other commercial ........................................... (65) (29) (18) (37) (19) (168)
Residential mortgages ..................................... 3 (14) 4 485 4 482
Other personal ................................................. 1,035 120 142 4,680 239 6,216
General provisions .......................................... (162) (223) (48) (63) (2) (498)
1,023 (220) 102 5,022 268 6,195
Foreign exchange and other movements ............. 551 (24) 14 60 37 638
Provisions at 31 December ................................. 4,812 522 943 5,714 568 12,559
Provisions against banks:
– specific provisions ....................................... 14 – 3 – – 17
Provisions against customers
– specific provisions ....................................... 4,036 320 785 4,364 512 10,017
– general provisions2 ....................................... 762 202 155 1,350 56 2,525
Provisions at 31 December ................................. 4,812 522 943 5,714 568 12,559
Provisions against customers as a percentage
of loans and advances to customers %%%%%%
– specific provisions ....................................... 1.43 0.40 1.27 1.72 6.56 1.46
– general provisions ........................................ 0.27 0.25 0.25 0.53 0.72 0.37
At 31 December ............................................. 1.70 0.65 1.52 2.25 7.28 1.83
1See table below ‘Net charge to the profit and loss account for bad and doubtful debts by geographical region’.
2General provisions are allocated to geographical segments based on the location of the office booking the provision. Consequently, the
general provision booked in Hong Kong may cover assets booked in branches located outside Hong Kong, principally in the Rest of
Asia-Pacific, as well as those booked in Hong Kong.