HSBC 2005 Annual Report Download - page 79
Download and view the complete annual report
Please find page 79 of the 2005 HSBC annual report below. You can navigate through the pages in the report by either clicking on the pages listed below, or by using the keyword search tool below to find specific information within the annual report.-
 1
1 -
2
-
3
-
4
-
5
-
6
-
7
-
8
-
9
-
10
-
11
-
12
-
13
-
14
-
15
-
16
-
17
-
18
-
19
-
20
-
21
-
22
-
23
-
24
-
25
-
26
-
27
-
28
-
29
-
30
-
31
-
32
-
33
-
34
-
35
-
36
-
37
-
38
-
39
-
40
-
41
-
42
-
43
-
44
-
45
-
46
-
47
-
48
-
49
-
50
-
51
-
52
-
53
-
54
-
55
-
56
-
57
-
58
-
59
-
60
-
61
-
62
-
63
-
64
-
65
-
66
-
67
-
68
-
 69
69 -
 70
70 -
 71
71 -
 72
72 -
 73
73 -
 74
74 -
 75
75 -
 76
76 -
 77
77 -
 78
78 -
 79
79 -
 80
80 -
 81
81 -
 82
82 -
 83
83 -
 84
84 -
 85
85 -
 86
86 -
 87
87 -
 88
88 -
 89
89 -
90
-
91
-
92
-
93
-
94
-
95
-
96
-
97
-
98
-
99
-
100
-
101
-
102
-
103
-
104
-
105
-
106
-
107
-
108
-
109
-
110
-
111
-
112
-
113
-
114
-
115
-
116
-
117
-
118
-
119
-
120
-
121
-
122
-
123
-
124
-
125
-
126
-
127
-
128
-
129
-
130
-
131
-
132
-
133
-
134
-
135
-
136
-
137
-
138
-
139
-
140
-
141
-
142
-
143
-
144
-
145
-
146
-
147
-
148
-
149
-
150
-
151
-
152
-
153
-
154
-
155
-
156
-
157
-
158
-
159
-
160
-
161
-
162
-
163
-
164
-
165
-
166
-
167
-
168
-
169
-
170
-
171
-
172
-
173
-
174
-
175
-
176
-
177
-
178
-
179
-
180
-
181
-
182
-
183
-
184
-
185
-
186
-
187
-
188
-
189
-
190
-
191
-
192
-
193
-
194
-
195
-
196
-
197
-
198
-
199
-
200
-
201
-
202
-
203
-
204
-
205
-
206
-
207
-
208
-
209
-
210
-
211
-
212
-
213
-
214
-
215
-
216
-
217
-
218
-
219
-
220
-
221
-
222
-
223
-
224
-
225
-
226
-
227
-
228
-
229
-
230
-
231
-
232
-
233
-
234
-
235
-
236
-
237
-
238
-
239
-
240
-
241
-
242
-
243
-
244
-
245
-
246
-
247
-
248
-
249
-
250
-
251
-
252
-
253
-
254
-
255
-
256
-
257
-
258
-
259
-
260
-
261
-
262
-
263
-
264
-
265
-
266
-
267
-
268
-
269
-
270
-
271
-
272
-
273
-
274
-
275
-
276
-
277
-
278
-
279
-
280
-
281
-
282
-
283
-
284
-
285
-
286
-
287
-
288
-
289
-
290
-
291
-
292
-
293
-
294
-
295
-
296
-
297
-
298
-
299
-
300
-
301
-
302
-
303
-
304
-
305
-
306
-
307
-
308
-
309
-
310
-
311
-
312
-
313
-
314
-
315
-
316
-
317
-
318
-
319
-
320
-
321
-
322
-
323
-
324
-
325
-
326
-
327
-
328
-
329
-
330
-
331
-
332
-
333
-
334
-
335
-
336
-
337
-
338
-
339
-
340
-
341
-
342
-
343
-
344
-
345
-
346
-
347
-
348
-
349
-
350
-
351
-
352
-
353
-
354
-
355
-
356
-
357
-
358
-
359
-
360
-
361
-
362
-
363
-
364
-
365
-
366
-
367
-
368
-
369
-
370
-
371
-
372
-
373
-
374
-
375
-
376
-
377
-
378
-
379
-
380
-
381
-
382
-
383
-
384
-
385
-
386
-
387
-
388
-
389
-
390
-
391
-
392
-
393
-
394
-
395
-
396
-
397
-
398
-
399
-
400
-
401
-
402
-
403
-
404
-
405
-
406
-
407
-
408
-
409
-
410
-
411
-
412
-
413
-
414
-
415
-
416
-
417
-
418
-
419
-
420
-
421
-
422
-
423
-
424
 |
 |
77
consequently deposit balances grew by 13 per cent,
while deposit spreads increased by 13 basis points.
Lending balances rose by 27 per cent, following the
selective recruitment of more experienced
relationship managers and a reorganisation of
customers into key industrial sectors to provide
greater focus on identifying service opportunities.
Asset spreads decreased by 42 basis points as a result
of competitive pressures and market liquidity.
In Taiwan, a loyalty campaign designed to
increase deposits, together with higher current
account income and an increase in deposit spreads,
contributed to an 80 per cent increase in net interest
income. In Mauritius, net interest income doubled as
a result of liability balance growth. In India,
increased trade contributed to higher trade services
net interest income and strong economic growth led
to higher demand for credit. This resulted in lending
balances increasing by 72 per cent, while customer
acquisition increased average current account
balances by 37 per cent. Liability spreads widened by
73 basis points following interest rate rises. In
Indonesia, increased sales efforts and a more focused
approach to customer relationship management
contributed to an 84 per cent growth in asset balances
and a 66 per cent increase in net interest income.
Net fee income of US$307 million was 15 per
cent higher than in 2004. In the Middle East,
increased trade flows led to a 17 per cent increase in
trade services income, while current account income
increased by 80 per cent, benefiting from the
introduction of new cash management capabilities.
Short-term IPO loan funding reflecting, in part,
robust regional capital market, also contributed to a
40 per cent increase in net fee income. In mainland
China, a 31 per cent increase in trade customers and a
significant rise in imports led to higher trade services
income, while a 49 per cent increase in current
account customers and higher lending fees also
contributed to an 8 per cent increase in fee income.
Increased lending, current account and trade
activities raised net fee income by 30 per cent in
Indonesia. A number of sites, including Vietnam and
Thailand, also reported strong growth, driven by the
success of HSBC’s strategy of focusing on business
opportunities involving international trade.
There was a net release of loan impairment
charges of US$67 million, following net charges in
2004. Credit quality in the Middle East improved. In
mainland China there was a significant reduction in
loan impairment charges as higher collective
impairment charges were more than offset by the
release of allowances against a small number of
accounts and the non-recurrence of a significant
charge against a single customer in 2004. In India,
strong economic growth led to improved credit
quality, while in Malaysia, Singapore and Indonesia,
credit quality improved significantly although
releases of impairment charges were lower than in
2004.
Operating expenses were 27 per cent higher than
last year, broadly in line with revenue growth. In the
Middle East, the recruitment of sales and support
staff substantially increased income, leading to
higher incentive payments. In mainland China,
revenue growth was driven by branch expansion,
increased sales and support staff and higher
marketing expenditure. In Malaysia, the direct sales
teams were expanded and business banking units
were extended to all branches in support of the
bank’s growth strategy, resulting in a 16 per cent
increase in costs.
In India, the recruitment of additional sales staff
boosted customer facing staff by 85 per cent in 2005.
In South Korea, staff recruitment and heightened
marketing activity supported HSBC’s four recently
established commercial banking centres, contributing
to an increase in costs. Higher costs throughout the
rest of the region largely reflected increases in sales
and support staff and initiatives to support business
expansion.
Increased income from associates reflected
strong performance in The Saudi British Bank and
gains on the sale of HSBC’s stake in MISR
International, an Egyptian Bank. Income from the
bank’s strategic investments in China, Bank of
Communications and Industrial Bank, which were
acquired in 2004, also increased.
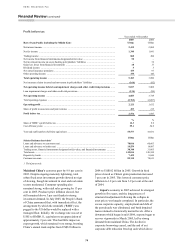
Corporate, Investment Banking and Markets
reported a pre-tax profit of US$1,207 million, an
increase of 22 per cent compared with 2004. HSBC’s
progress in this region was marked by positive
revenue trends across most countries, with strong
growth being reported in the Middle East, Malaysia,
South Korea, India and mainland China.
Operating income rose by 25 per cent to
US$1,769 million. Higher Corporate and Institutional
Banking revenues reflected a 53 per cent increase in
lending balances in mainland China, a result of
strong demand for corporate credit, primarily from
the industrial and technology sector. Deposit
balances increased by 36 per cent and, together with
a 40 basis point rise in deposit spreads, this also
contributed to the growth in revenues.
HSBC’s operations in the Middle East reported a
63 per cent rise in customer advances, primarily due
to strong demand for corporate credit, driven by
government spending on regional infrastructure