HSBC 2005 Annual Report Download - page 221
Download and view the complete annual report
Please find page 221 of the 2005 HSBC annual report below. You can navigate through the pages in the report by either clicking on the pages listed below, or by using the keyword search tool below to find specific information within the annual report.-
 1
1 -
2
-
3
-
4
-
5
-
6
-
7
-
8
-
9
-
10
-
11
-
12
-
13
-
14
-
15
-
16
-
17
-
18
-
19
-
20
-
21
-
22
-
23
-
24
-
25
-
26
-
27
-
28
-
29
-
30
-
31
-
32
-
33
-
34
-
35
-
36
-
37
-
38
-
39
-
40
-
41
-
42
-
43
-
44
-
45
-
46
-
47
-
48
-
49
-
50
-
51
-
52
-
53
-
54
-
55
-
56
-
57
-
58
-
59
-
60
-
61
-
62
-
63
-
64
-
65
-
66
-
67
-
68
-
69
-
70
-
71
-
72
-
73
-
74
-
75
-
76
-
77
-
78
-
79
-
80
-
81
-
82
-
83
-
84
-
85
-
86
-
87
-
88
-
89
-
90
-
91
-
92
-
93
-
94
-
95
-
96
-
97
-
98
-
99
-
100
-
101
-
102
-
103
-
104
-
105
-
106
-
107
-
108
-
109
-
110
-
111
-
112
-
113
-
114
-
115
-
116
-
117
-
118
-
119
-
120
-
121
-
122
-
123
-
124
-
125
-
126
-
127
-
128
-
129
-
130
-
131
-
132
-
133
-
134
-
135
-
136
-
137
-
138
-
139
-
140
-
141
-
142
-
143
-
144
-
145
-
146
-
147
-
148
-
149
-
150
-
151
-
152
-
153
-
154
-
155
-
156
-
157
-
158
-
159
-
160
-
161
-
162
-
163
-
164
-
165
-
166
-
167
-
168
-
169
-
170
-
171
-
172
-
173
-
174
-
175
-
176
-
177
-
178
-
179
-
180
-
181
-
182
-
183
-
184
-
185
-
186
-
187
-
188
-
189
-
190
-
191
-
192
-
193
-
194
-
195
-
196
-
197
-
198
-
199
-
200
-
201
-
202
-
203
-
204
-
205
-
206
-
207
-
208
-
209
-
210
-
 211
211 -
 212
212 -
 213
213 -
 214
214 -
 215
215 -
 216
216 -
 217
217 -
 218
218 -
 219
219 -
 220
220 -
 221
221 -
 222
222 -
 223
223 -
 224
224 -
 225
225 -
 226
226 -
 227
227 -
 228
228 -
 229
229 -
 230
230 -
 231
231 -
232
-
233
-
234
-
235
-
236
-
237
-
238
-
239
-
240
-
241
-
242
-
243
-
244
-
245
-
246
-
247
-
248
-
249
-
250
-
251
-
252
-
253
-
254
-
255
-
256
-
257
-
258
-
259
-
260
-
261
-
262
-
263
-
264
-
265
-
266
-
267
-
268
-
269
-
270
-
271
-
272
-
273
-
274
-
275
-
276
-
277
-
278
-
279
-
280
-
281
-
282
-
283
-
284
-
285
-
286
-
287
-
288
-
289
-
290
-
291
-
292
-
293
-
294
-
295
-
296
-
297
-
298
-
299
-
300
-
301
-
302
-
303
-
304
-
305
-
306
-
307
-
308
-
309
-
310
-
311
-
312
-
313
-
314
-
315
-
316
-
317
-
318
-
319
-
320
-
321
-
322
-
323
-
324
-
325
-
326
-
327
-
328
-
329
-
330
-
331
-
332
-
333
-
334
-
335
-
336
-
337
-
338
-
339
-
340
-
341
-
342
-
343
-
344
-
345
-
346
-
347
-
348
-
349
-
350
-
351
-
352
-
353
-
354
-
355
-
356
-
357
-
358
-
359
-
360
-
361
-
362
-
363
-
364
-
365
-
366
-
367
-
368
-
369
-
370
-
371
-
372
-
373
-
374
-
375
-
376
-
377
-
378
-
379
-
380
-
381
-
382
-
383
-
384
-
385
-
386
-
387
-
388
-
389
-
390
-
391
-
392
-
393
-
394
-
395
-
396
-
397
-
398
-
399
-
400
-
401
-
402
-
403
-
404
-
405
-
406
-
407
-
408
-
409
-
410
-
411
-
412
-
413
-
414
-
415
-
416
-
417
-
418
-
419
-
420
-
421
-
422
-
423
-
424
 |
 |
219
applies to 2006 and, as far as possible, for
subsequent years. Any changes in policy for
subsequent years will be described in future reports
on Directors’ remuneration.
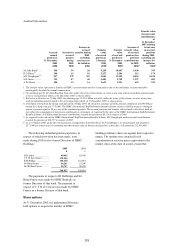
Salary
The
Committee
reviews
salary levels for executive
Directors
each year
in
the
same
context
as
other
employees.
With reference to market practice
and
taking
account
of the international nature of the
Group,
the
Committee
benchmarks
the
salary
of
each
Director
and member of Senior Management against
those
of comparable executives
in large,
diverse
companies.
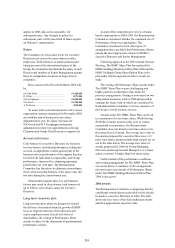
Base salaries with effect from March 2006 will
be:
Sir John Bond ............................................. £1,400,000
D J Flint ...................................................... £575,000
M F Geoghegan .......................................... £1,000,000
S K Green ................................................... £1,250,000
A W Jebson ................................................ £550,000
To assist with a smooth transition to the revised
organisation structure announced in November 2005
and with the aim of having only one salary
adjustment per year, the salary increases for
S K Green and M F Geoghegan incorporate
adjustments for their new appointments as Group
Chairman and Group Chief Executive respectively.
Annual cash bonus
Cash bonuses for executive Directors are based on
two key factors: individual performance, taking into
account, as appropriate, results against plan of the
business unit or performance of the support function
for which the individual is responsible; and Group
performance, measured by comparing operating
profit before tax with plan. The Remuneration
Committee has discretion to eliminate extraordinary
items when assessing bonuses, if the main cause did
not arise during the current bonus year.
Measurement against these key performance
factors may result in discretionary cash bonuses of
up to 250 per cent of basic salary for executive
Directors.
Long-term incentive plan
Long-term incentive plans are designed to reward
the delivery of sustained financial growth of HSBC.
So as to align the interests of the Directors and
senior employees more closely with those of
shareholders, the vesting of Performance Share
awards is subject to the attainment of predetermined
performance criteria.
As part of the comprehensive review of share-
based remuneration in 2004-2005, the Remuneration
Committee considered whether the continued use of
Performance Shares was appropriate. The
Committee considered several other types of
arrangement but concluded that Performance Shares
remain the most appropriate vehicle for HSBC’s
executive Directors and Senior Management.
Following approval at the 2005 Annual General
Meeting, The HSBC Share Plan has replaced the
HSBC Holdings Restricted Share Plan 2000 and the
HSBC Holdings Group Share Option Plan as the
plan under which long-term incentive awards are
made.
The vesting of Performance Share awards under
The HSBC Share Plan is more challenging and
highly geared to performance than under the
previous arrangements. Vesting is now based on two
independent measures, relative TSR and growth in
earnings per share, both of which are considered by
the Remuneration Committee to be key measures of
the Group’s overall business success.
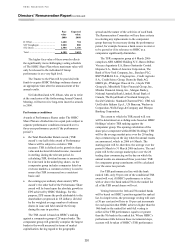
Awards under The HSBC Share Plan can be up
to a maximum of seven times salary. Whilst having
flexibility to make awards at this level in certain
exceptional circumstances, the Remuneration
Committee does not intend seven times salary to be
the normal level of award. The average face value of
the awards proposed for executive Directors is 2.3
times base salary; proposed individual awards are set
out in the table below. The average face value of
awards proposed for 2006 for Group Managing
Directors and Group General Managers is 1.6 times
salary; no award is higher than four times salary.
Further details of the performance conditions
and vesting arrangements for The HSBC Share Plan
are set out below. A summary of the arrangements
relevant to previous awards of Performance Shares
under The HSBC Holdings Restricted Share Plan
2000 is also given.
2006 awards
The Remuneration Committee is proposing that the
conditional awards shown in the table below should
be made to executive Directors in 2006. The table
shows the face value of the full conditional awards
and their approximate expected value.