HSBC 2005 Annual Report Download - page 312
Download and view the complete annual report
Please find page 312 of the 2005 HSBC annual report below. You can navigate through the pages in the report by either clicking on the pages listed below, or by using the keyword search tool below to find specific information within the annual report.-
 1
1 -
2
-
3
-
4
-
5
-
6
-
7
-
8
-
9
-
10
-
11
-
12
-
13
-
14
-
15
-
16
-
17
-
18
-
19
-
20
-
21
-
22
-
23
-
24
-
25
-
26
-
27
-
28
-
29
-
30
-
31
-
32
-
33
-
34
-
35
-
36
-
37
-
38
-
39
-
40
-
41
-
42
-
43
-
44
-
45
-
46
-
47
-
48
-
49
-
50
-
51
-
52
-
53
-
54
-
55
-
56
-
57
-
58
-
59
-
60
-
61
-
62
-
63
-
64
-
65
-
66
-
67
-
68
-
69
-
70
-
71
-
72
-
73
-
74
-
75
-
76
-
77
-
78
-
79
-
80
-
81
-
82
-
83
-
84
-
85
-
86
-
87
-
88
-
89
-
90
-
91
-
92
-
93
-
94
-
95
-
96
-
97
-
98
-
99
-
100
-
101
-
102
-
103
-
104
-
105
-
106
-
107
-
108
-
109
-
110
-
111
-
112
-
113
-
114
-
115
-
116
-
117
-
118
-
119
-
120
-
121
-
122
-
123
-
124
-
125
-
126
-
127
-
128
-
129
-
130
-
131
-
132
-
133
-
134
-
135
-
136
-
137
-
138
-
139
-
140
-
141
-
142
-
143
-
144
-
145
-
146
-
147
-
148
-
149
-
150
-
151
-
152
-
153
-
154
-
155
-
156
-
157
-
158
-
159
-
160
-
161
-
162
-
163
-
164
-
165
-
166
-
167
-
168
-
169
-
170
-
171
-
172
-
173
-
174
-
175
-
176
-
177
-
178
-
179
-
180
-
181
-
182
-
183
-
184
-
185
-
186
-
187
-
188
-
189
-
190
-
191
-
192
-
193
-
194
-
195
-
196
-
197
-
198
-
199
-
200
-
201
-
202
-
203
-
204
-
205
-
206
-
207
-
208
-
209
-
210
-
211
-
212
-
213
-
214
-
215
-
216
-
217
-
218
-
219
-
220
-
221
-
222
-
223
-
224
-
225
-
226
-
227
-
228
-
229
-
230
-
231
-
232
-
233
-
234
-
235
-
236
-
237
-
238
-
239
-
240
-
241
-
242
-
243
-
244
-
245
-
246
-
247
-
248
-
249
-
250
-
251
-
252
-
253
-
254
-
255
-
256
-
257
-
258
-
259
-
260
-
261
-
262
-
263
-
264
-
265
-
266
-
267
-
268
-
269
-
270
-
271
-
272
-
273
-
274
-
275
-
276
-
277
-
278
-
279
-
280
-
281
-
282
-
283
-
284
-
285
-
286
-
287
-
288
-
289
-
290
-
291
-
292
-
293
-
294
-
295
-
296
-
297
-
298
-
299
-
300
-
301
-
 302
302 -
 303
303 -
 304
304 -
 305
305 -
 306
306 -
 307
307 -
 308
308 -
 309
309 -
 310
310 -
 311
311 -
 312
312 -
 313
313 -
 314
314 -
 315
315 -
 316
316 -
 317
317 -
 318
318 -
 319
319 -
 320
320 -
 321
321 -
 322
322 -
323
-
324
-
325
-
326
-
327
-
328
-
329
-
330
-
331
-
332
-
333
-
334
-
335
-
336
-
337
-
338
-
339
-
340
-
341
-
342
-
343
-
344
-
345
-
346
-
347
-
348
-
349
-
350
-
351
-
352
-
353
-
354
-
355
-
356
-
357
-
358
-
359
-
360
-
361
-
362
-
363
-
364
-
365
-
366
-
367
-
368
-
369
-
370
-
371
-
372
-
373
-
374
-
375
-
376
-
377
-
378
-
379
-
380
-
381
-
382
-
383
-
384
-
385
-
386
-
387
-
388
-
389
-
390
-
391
-
392
-
393
-
394
-
395
-
396
-
397
-
398
-
399
-
400
-
401
-
402
-
403
-
404
-
405
-
406
-
407
-
408
-
409
-
410
-
411
-
412
-
413
-
414
-
415
-
416
-
417
-
418
-
419
-
420
-
421
-
422
-
423
-
424
 |
 |

HSBC HOLDINGS PLC
Notes on the Financial Statements (continued)
310
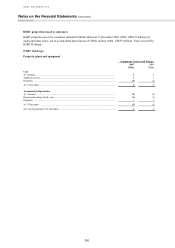
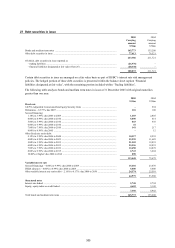
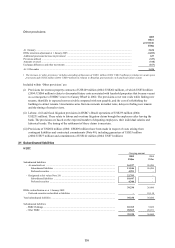
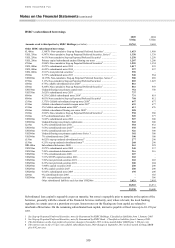
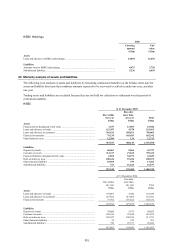
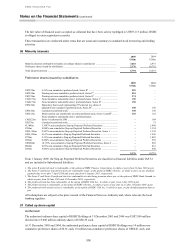
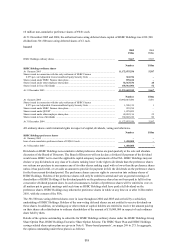
HSBC’s subordinated borrowings
2005 2004
US$m US$m
Amounts owed to third parties by HSBC Holdings (see below) ............................................... 10,765 9,669
Other HSBC subordinated borrowings
€1,400m 5.3687% Non-cumulative Step-up Perpetual Preferred Securities1 .................... 1,653 1,908
US$1,350m 9.547% Non-cumulative Step-up Perpetual Preferred Securities, Series 11 ....... 1,350 1,338
US$1,250m 4.61% Non-cumulative Step-up Perpetual Preferred Securities1 ........................ 1,250 1,250
US$1,200m Primary capital subordinated undated floating rate notes .................................. 1,207 1,200
£700m 5.844% Non-cumulative Step-up Perpetual Preferred Securities2 ...................... 1,205 1,354
US$1,000m 5.875% subordinated notes 2034 ....................................................................... 1,017 993
US$1,000m 4.625% subordinated notes 2014 ....................................................................... 997 997
US$1,000m 5.911% trust preferred securities3 ...................................................................... 990 –
£500m 5.375% subordinated notes 2033 ....................................................................... 940 964
US$900m 10.176% Non-cumulative Step-up Perpetual Preferred Securities, Series 21 ..... 900 889
€750m 5.13% Non-cumulative Step-up Perpetual Preferred Securities1 ........................ 885 1,025
£500m 4.75% callable subordinated notes 20204 .......................................................... 861 –
£500m 8.208% Non-cumulative Step-up Perpetual Preferred Securities1 ...................... 861 958
US$750m Undated floating rate primary capital notes ....................................................... 752 750
US$750m 5.625% subordinated notes 2035 ....................................................................... 737 –
€600m 4.25% Callable subordinated notes 20165 .......................................................... 731 819
€600m 8.03% Non-cumulative Step-up Perpetual Preferred Securities1 ........................ 708 812
£350m 5.375% Callable subordinated step-up notes 20306 ........................................... 647 677
£350m Callable subordinated variable coupon notes 20177 ........................................... 635 677
£350m 5% Callable subordinated notes 20238 ............................................................... 613 676
€500m Callable subordinated floating rate notes 20209 ................................................. 588 –
£300m 5.862% Non-cumulative Step-up Perpetual Preferred Securities2 ...................... 558 580
£300m 6.5% subordinated notes 2023 ........................................................................... 509 577
US$500m 7.625% subordinated notes 2006 ....................................................................... 507 500
US$500m Undated floating rate primary capital notes ....................................................... 502 500
£225m 6.25% subordinated notes 2041 ......................................................................... 384 432
US$300m 7.65% subordinated notes 202510 ...................................................................... 358 300
US$300m 6.95% subordinated notes 2011 ......................................................................... 326 300
US$300m Undated floating rate primary capital notes Series 3 .......................................... 302 300
US$300m 7% subordinated notes 2006 .............................................................................. 300 300
£150m 8.625% step-up undated subordinated notes11 ................................................... 277 290
£150m 9.25% step-up undated subordinated notes12 ..................................................... 268 290
BRL608m Subordinated debentures 2008 ........................................................................... 261 229
US$250m 5.875% subordinated notes 2008 ....................................................................... 240 237
US$250m 7.20% subordinated debentures 2097 ................................................................ 216 216
US$200m 7.75% subordinated notes 2009 ......................................................................... 207 –
US$200m 7.53% STOPS capital securities 2026 ............................................................... 202 –
US$200m 7.50% trust preferred securities 2031 ................................................................. 202 203
US$200m 8.25% trust preferred securities 2031 ................................................................. 200 204
US$200m 7.808% capital securities 2026 .......................................................................... 200 200
US$200m 8.38% capital securities 2027 ............................................................................ 200 200
US$200m 6.625% subordinated notes 2009 ....................................................................... 198 200
£200m 9% subordinated notes 2005 .............................................................................. –385
US$300m 10% trust preferred securities ........................................................................... –306
Other subordinated liabilities each less than US$200m ..................................... 2,621 2,895
28,565 26,931
39,330 36,600
Subordinated loan capital is repayable at par on maturity, but some is repayable prior to maturity at the option of the
borrower, generally with the consent of the Financial Services Authority, and, where relevant, the local banking
regulator, in certain cases at a premium over par. Interest rates on the floating rate loan capital are related to
interbank offered rates. On the remaining subordinated loan capital, interest is payable at fixed rates up to 10.176 per
cent.
1See Step-up Perpetual Preferred Securities, note (a) Guaranteed by HSBC Holdings. Classified as liabilities from 1 January 2005.
2See Step-up Perpetual Preferred Securities, note (b) Guaranteed by HSBC Bank. . Classified as liabilities from 1 January 2005.
3The distributions on the trust preferred securities change in November 2015 to three-month dollar LIBOR plus 1.926 per cent.
4The interest rate on the 4.75 per cent callable subordinated notes 2020 changes in September 2015 to three-month sterling LIBOR
plus 0.82 per cent.