HSBC 2005 Annual Report Download - page 90
Download and view the complete annual report
Please find page 90 of the 2005 HSBC annual report below. You can navigate through the pages in the report by either clicking on the pages listed below, or by using the keyword search tool below to find specific information within the annual report.-
 1
1 -
2
-
3
-
4
-
5
-
6
-
7
-
8
-
9
-
10
-
11
-
12
-
13
-
14
-
15
-
16
-
17
-
18
-
19
-
20
-
21
-
22
-
23
-
24
-
25
-
26
-
27
-
28
-
29
-
30
-
31
-
32
-
33
-
34
-
35
-
36
-
37
-
38
-
39
-
40
-
41
-
42
-
43
-
44
-
45
-
46
-
47
-
48
-
49
-
50
-
51
-
52
-
53
-
54
-
55
-
56
-
57
-
58
-
59
-
60
-
61
-
62
-
63
-
64
-
65
-
66
-
67
-
68
-
69
-
70
-
71
-
72
-
73
-
74
-
75
-
76
-
77
-
78
-
79
-
 80
80 -
 81
81 -
 82
82 -
 83
83 -
 84
84 -
 85
85 -
 86
86 -
 87
87 -
 88
88 -
 89
89 -
 90
90 -
 91
91 -
 92
92 -
 93
93 -
 94
94 -
 95
95 -
 96
96 -
 97
97 -
 98
98 -
 99
99 -
 100
100 -
101
-
102
-
103
-
104
-
105
-
106
-
107
-
108
-
109
-
110
-
111
-
112
-
113
-
114
-
115
-
116
-
117
-
118
-
119
-
120
-
121
-
122
-
123
-
124
-
125
-
126
-
127
-
128
-
129
-
130
-
131
-
132
-
133
-
134
-
135
-
136
-
137
-
138
-
139
-
140
-
141
-
142
-
143
-
144
-
145
-
146
-
147
-
148
-
149
-
150
-
151
-
152
-
153
-
154
-
155
-
156
-
157
-
158
-
159
-
160
-
161
-
162
-
163
-
164
-
165
-
166
-
167
-
168
-
169
-
170
-
171
-
172
-
173
-
174
-
175
-
176
-
177
-
178
-
179
-
180
-
181
-
182
-
183
-
184
-
185
-
186
-
187
-
188
-
189
-
190
-
191
-
192
-
193
-
194
-
195
-
196
-
197
-
198
-
199
-
200
-
201
-
202
-
203
-
204
-
205
-
206
-
207
-
208
-
209
-
210
-
211
-
212
-
213
-
214
-
215
-
216
-
217
-
218
-
219
-
220
-
221
-
222
-
223
-
224
-
225
-
226
-
227
-
228
-
229
-
230
-
231
-
232
-
233
-
234
-
235
-
236
-
237
-
238
-
239
-
240
-
241
-
242
-
243
-
244
-
245
-
246
-
247
-
248
-
249
-
250
-
251
-
252
-
253
-
254
-
255
-
256
-
257
-
258
-
259
-
260
-
261
-
262
-
263
-
264
-
265
-
266
-
267
-
268
-
269
-
270
-
271
-
272
-
273
-
274
-
275
-
276
-
277
-
278
-
279
-
280
-
281
-
282
-
283
-
284
-
285
-
286
-
287
-
288
-
289
-
290
-
291
-
292
-
293
-
294
-
295
-
296
-
297
-
298
-
299
-
300
-
301
-
302
-
303
-
304
-
305
-
306
-
307
-
308
-
309
-
310
-
311
-
312
-
313
-
314
-
315
-
316
-
317
-
318
-
319
-
320
-
321
-
322
-
323
-
324
-
325
-
326
-
327
-
328
-
329
-
330
-
331
-
332
-
333
-
334
-
335
-
336
-
337
-
338
-
339
-
340
-
341
-
342
-
343
-
344
-
345
-
346
-
347
-
348
-
349
-
350
-
351
-
352
-
353
-
354
-
355
-
356
-
357
-
358
-
359
-
360
-
361
-
362
-
363
-
364
-
365
-
366
-
367
-
368
-
369
-
370
-
371
-
372
-
373
-
374
-
375
-
376
-
377
-
378
-
379
-
380
-
381
-
382
-
383
-
384
-
385
-
386
-
387
-
388
-
389
-
390
-
391
-
392
-
393
-
394
-
395
-
396
-
397
-
398
-
399
-
400
-
401
-
402
-
403
-
404
-
405
-
406
-
407
-
408
-
409
-
410
-
411
-
412
-
413
-
414
-
415
-
416
-
417
-
418
-
419
-
420
-
421
-
422
-
423
-
424
 |
 |

HSBC HOLDINGS PLC
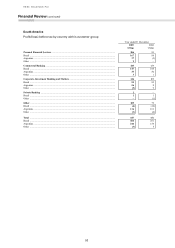
Financial Review (continued)
88
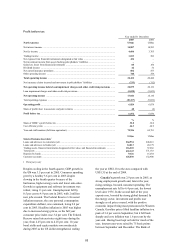
position in small business administration lending in
New York state. Following its launch in the first half
of 2005, the ‘Select Investor’ product, which offers
competitive tiered interest rates, attracted
US$420 million of deposits. ‘Business Smart’, a
product offering free checking and other value
offerings to commercial customers, performed
strongly following its launch at the end of 2004,
attracting 41,000 new customers and balances of
over US$1.0 billion.
In Canada, net interest income increased by
16 per cent, as higher oil and other natural resource
prices led to strong economic growth and low
interest rates increased demand for lending products.
Average lending balances increased by 20 per cent,
as leasing balances grew by 33 per cent and
commercial real estate lending rose by 19 per cent.
Average deposit and current account balances
increased by 21 per cent and 24 per cent
respectively, reflecting the buoyant economy, the
launch of HSBCnet in Canada and more brand
advertising. Both asset and liability spreads were
broadly in line with 2004.
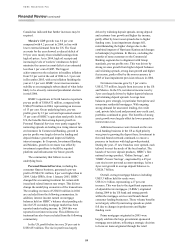
In Mexico, the transfer of a number of
customers from Personal Financial Services
increased both revenues and costs. Net interest
income increased by 42 per cent, due in part to a
22 per cent increase in Commercial Banking
customers. Deposit balances grew by 38 per cent as a
result of expansion into the SME market, while
deposit spreads increased by 76 basis points
following interest rate rises. Loan balances rose by
21 per cent, principally in the services and
commerce sectors, though competitive pricing led to
a tightening of lending spreads. The ‘Estimulo’
combined loan and overdraft product, which was
launched at the end of 2004, performed strongly,
attracting balances of US$155 million.
Other income lines, including net fee income,
increased by 11 per cent to US$541 million. In
Mexico, marketing campaigns, tariff reductions and
the promotion of business internet banking, together
with increased customer numbers, contributed to a
31 per cent increase in payment and cash
management fees, while card fees increased
following the launch of a credit card as part of the
‘Estimulo’ suite of products. Trade services fee
income increased by 63 per cent as a result of
customer acquisition and increased cross-sales to
existing customers, nearly doubling the bank’s
market share in a growing market. In the US, higher
gains on the sale of properties and investments
contributed to a 4 per cent increase in other income.
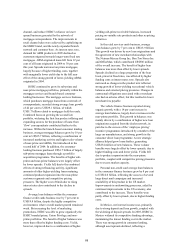
Loan impairment charges were US$13 million,
following net releases in 2004. Significant releases
in Canada were more than offset by higher charges,
driven by lending growth, in the US and Mexico. In
Canada, improved credit quality led to a
US$34 million net release of loan impairment
provisions. In the US, credit quality remained high in
the favourable economic conditions, with impaired
loans as a proportion of assets decreasing by 49 basis
points. In Mexico, growth in the lending portfolio
led to a US$49 million increase in loan impairment
charges, although underlying credit quality
improved.
Operating expenses increased by 13 per cent to
US$913 million, driven by increases in the US and
Mexico. In the US, expansion in the SME and MME
markets and in the commercial mortgage sector led
to a 17 per cent increase in staff numbers. New
MME offices were opened in Philadelphia and New
Jersey, following the establishment of offices in Los
Angeles and San Francisco in 2004. The launch of
‘Select Investor’ and promotion of ‘Business Smart’
led to higher marketing costs. In Mexico, operating
expenses increased by 29 per cent, due to an 11 per
cent increase in staff numbers to support business
growth, higher incentive payments reflecting strong
income growth, and increased ‘Estimulo’ marketing
expenditure.
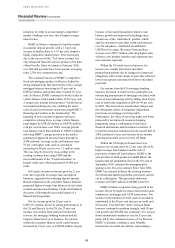
Corporate, Investment Banking and Markets
reported a pre-tax profit of US$774 million, 22 per
cent lower than in 2004. The overall increase in
revenue was exceeded by higher expenses, which
reflected the full year cost of the expanded
operations in the US and the continuing investment
in a number of specific initiatives designed to build
stronger execution and delivery capabilities.
Total operating income rose by 12 per cent. In
Mexico, net income more than doubled, due to the
strong performance in balance sheet management,
which benefited from higher volumes and successful
strategic positioning against a rising short-term
interest rate environment, with an overall flattening
of the yield curve in the first part of 2005. In the
latter half of the year, positions were effectively
managed to take advantage of the decline in local
rates. In the US and Canada, balance sheet
management and money market revenues declined
by US$353 million, as rising US dollar short-term
interest rates led to further flattening of the yield
curve.
Net interest income from the payments and cash
management business in the US grew by 65 per cent,
principally due to an 82 per cent growth in balances.
Net fees increased by 25 per cent, primarily due