HSBC 2005 Annual Report Download - page 279
Download and view the complete annual report
Please find page 279 of the 2005 HSBC annual report below. You can navigate through the pages in the report by either clicking on the pages listed below, or by using the keyword search tool below to find specific information within the annual report.-
 1
1 -
2
-
3
-
4
-
5
-
6
-
7
-
8
-
9
-
10
-
11
-
12
-
13
-
14
-
15
-
16
-
17
-
18
-
19
-
20
-
21
-
22
-
23
-
24
-
25
-
26
-
27
-
28
-
29
-
30
-
31
-
32
-
33
-
34
-
35
-
36
-
37
-
38
-
39
-
40
-
41
-
42
-
43
-
44
-
45
-
46
-
47
-
48
-
49
-
50
-
51
-
52
-
53
-
54
-
55
-
56
-
57
-
58
-
59
-
60
-
61
-
62
-
63
-
64
-
65
-
66
-
67
-
68
-
69
-
70
-
71
-
72
-
73
-
74
-
75
-
76
-
77
-
78
-
79
-
80
-
81
-
82
-
83
-
84
-
85
-
86
-
87
-
88
-
89
-
90
-
91
-
92
-
93
-
94
-
95
-
96
-
97
-
98
-
99
-
100
-
101
-
102
-
103
-
104
-
105
-
106
-
107
-
108
-
109
-
110
-
111
-
112
-
113
-
114
-
115
-
116
-
117
-
118
-
119
-
120
-
121
-
122
-
123
-
124
-
125
-
126
-
127
-
128
-
129
-
130
-
131
-
132
-
133
-
134
-
135
-
136
-
137
-
138
-
139
-
140
-
141
-
142
-
143
-
144
-
145
-
146
-
147
-
148
-
149
-
150
-
151
-
152
-
153
-
154
-
155
-
156
-
157
-
158
-
159
-
160
-
161
-
162
-
163
-
164
-
165
-
166
-
167
-
168
-
169
-
170
-
171
-
172
-
173
-
174
-
175
-
176
-
177
-
178
-
179
-
180
-
181
-
182
-
183
-
184
-
185
-
186
-
187
-
188
-
189
-
190
-
191
-
192
-
193
-
194
-
195
-
196
-
197
-
198
-
199
-
200
-
201
-
202
-
203
-
204
-
205
-
206
-
207
-
208
-
209
-
210
-
211
-
212
-
213
-
214
-
215
-
216
-
217
-
218
-
219
-
220
-
221
-
222
-
223
-
224
-
225
-
226
-
227
-
228
-
229
-
230
-
231
-
232
-
233
-
234
-
235
-
236
-
237
-
238
-
239
-
240
-
241
-
242
-
243
-
244
-
245
-
246
-
247
-
248
-
249
-
250
-
251
-
252
-
253
-
254
-
255
-
256
-
257
-
258
-
259
-
260
-
261
-
262
-
263
-
264
-
265
-
266
-
267
-
268
-
 269
269 -
 270
270 -
 271
271 -
 272
272 -
 273
273 -
 274
274 -
 275
275 -
 276
276 -
 277
277 -
 278
278 -
 279
279 -
 280
280 -
 281
281 -
 282
282 -
 283
283 -
 284
284 -
 285
285 -
 286
286 -
 287
287 -
 288
288 -
 289
289 -
290
-
291
-
292
-
293
-
294
-
295
-
296
-
297
-
298
-
299
-
300
-
301
-
302
-
303
-
304
-
305
-
306
-
307
-
308
-
309
-
310
-
311
-
312
-
313
-
314
-
315
-
316
-
317
-
318
-
319
-
320
-
321
-
322
-
323
-
324
-
325
-
326
-
327
-
328
-
329
-
330
-
331
-
332
-
333
-
334
-
335
-
336
-
337
-
338
-
339
-
340
-
341
-
342
-
343
-
344
-
345
-
346
-
347
-
348
-
349
-
350
-
351
-
352
-
353
-
354
-
355
-
356
-
357
-
358
-
359
-
360
-
361
-
362
-
363
-
364
-
365
-
366
-
367
-
368
-
369
-
370
-
371
-
372
-
373
-
374
-
375
-
376
-
377
-
378
-
379
-
380
-
381
-
382
-
383
-
384
-
385
-
386
-
387
-
388
-
389
-
390
-
391
-
392
-
393
-
394
-
395
-
396
-
397
-
398
-
399
-
400
-
401
-
402
-
403
-
404
-
405
-
406
-
407
-
408
-
409
-
410
-
411
-
412
-
413
-
414
-
415
-
416
-
417
-
418
-
419
-
420
-
421
-
422
-
423
-
424
 |
 |

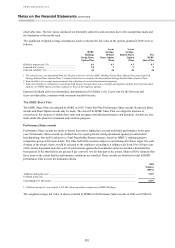
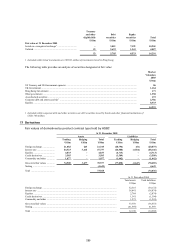
277
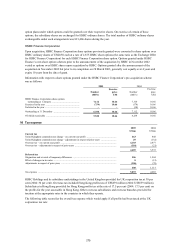
Number of shares (millions)
2005 2004
Average number of shares in issue ................................................................................................ 11,038 10,907
Dilutive share options and share awards ........................................................................................133 147
– Savings-related Share Option Plan ......................................................................................... 22 38
– Executive Share Option Scheme ............................................................................................ 11 12
– Group Share Option Plan ........................................................................................................ 14 13
– Restricted Share Plan .............................................................................................................. 70 63
– HSBC France share options ....................................................................................................10 13
– HSBC Finance share options .................................................................................................. 68
Average number of shares in issue assuming dilution ................................................................... 11,171 11,054
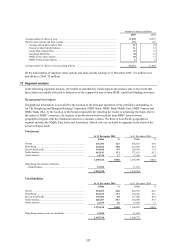
Of the total number of employee share options and share awards existing at 31 December 2005, 121 million were
anti-dilutive (2004: 70 million).
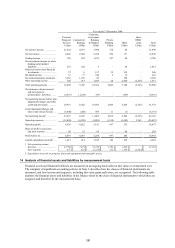
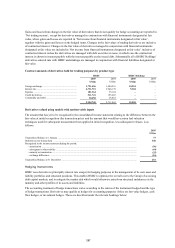
13 Segment analysis
In the following segmental analysis, the benefit of shareholders’ funds impacts the analysis only to the extent that
these funds are actually allocated to businesses in the segment by way of intra-HSBC capital and funding structures.
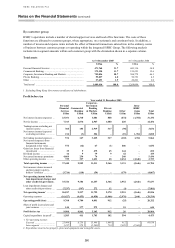
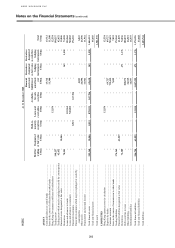
By geographical region
Geographical information is classified by the location of the principal operations of the subsidiary undertaking, or,
for The Hongkong and Shanghai Banking Corporation, HSBC Bank, HSBC Bank Middle East, HSBC Finance and
HSBC Bank USA, by the location of the branch responsible for reporting the results or advancing the funds. Due to
the nature of HSBC’s structure, the analysis of profits shown below includes intra-HSBC items between
geographical regions with the elimination shown in a separate column. The Rest of Asia-Pacific geographical
segment includes the Middle East, India and Australasia. Shared costs are included in segments on the basis of the
actual recharges made.
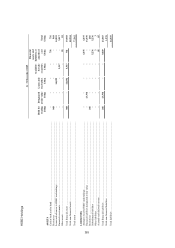
Total assets
At 31 December 2005 At 31 December 2004
US$m % US$m %
Europe ...................................................................................... 636,703 42.7 545,557 43.0
Hong Kong ............................................................................... 222,822 15.0 213,458 16.8
Rest of Asia-Pacific .................................................................. 142,014 9.5 120,530 9.5
North America .......................................................................... 463,143 31.1 371,183 29.3
South America .......................................................................... 24,734 1.7 17,368 1.4
1,489,416 100.0 1,268,096 100.0
Hong Kong Government certificates
of indebtedness ..................................................................... 12,554 11,878
1,501,970 1,279,974
Total liabilities
At 31 December 2005 At 31 December 2004
US$m % US$m %
Europe ...................................................................................... 594,953 42.8 499,579 42.8
Hong Kong ............................................................................... 210,539 15.1 194,436 16.6
Rest of Asia-Pacific .................................................................. 136,892 9.8 117,208 10.0
North America .......................................................................... 426,467 30.7 342,008 29.3
South America .......................................................................... 22,339 1.6 15,668 1.3
1,391,190 100.0 1,168,899 100.0
Hong Kong currency notes in circulation ................................. 12,554 11,878
1,403,744 1,180,777