HSBC 2005 Annual Report Download - page 5
Download and view the complete annual report
Please find page 5 of the 2005 HSBC annual report below. You can navigate through the pages in the report by either clicking on the pages listed below, or by using the keyword search tool below to find specific information within the annual report.-
 1
1 -
 2
2 -
 3
3 -
 4
4 -
 5
5 -
 6
6 -
 7
7 -
 8
8 -
 9
9 -
 10
10 -
 11
11 -
 12
12 -
 13
13 -
 14
14 -
 15
15 -
 16
16 -
17
-
18
-
19
-
20
-
21
-
22
-
23
-
24
-
25
-
26
-
27
-
28
-
29
-
30
-
31
-
32
-
33
-
34
-
35
-
36
-
37
-
38
-
39
-
40
-
41
-
42
-
43
-
44
-
45
-
46
-
47
-
48
-
49
-
50
-
51
-
52
-
53
-
54
-
55
-
56
-
57
-
58
-
59
-
60
-
61
-
62
-
63
-
64
-
65
-
66
-
67
-
68
-
69
-
70
-
71
-
72
-
73
-
74
-
75
-
76
-
77
-
78
-
79
-
80
-
81
-
82
-
83
-
84
-
85
-
86
-
87
-
88
-
89
-
90
-
91
-
92
-
93
-
94
-
95
-
96
-
97
-
98
-
99
-
100
-
101
-
102
-
103
-
104
-
105
-
106
-
107
-
108
-
109
-
110
-
111
-
112
-
113
-
114
-
115
-
116
-
117
-
118
-
119
-
120
-
121
-
122
-
123
-
124
-
125
-
126
-
127
-
128
-
129
-
130
-
131
-
132
-
133
-
134
-
135
-
136
-
137
-
138
-
139
-
140
-
141
-
142
-
143
-
144
-
145
-
146
-
147
-
148
-
149
-
150
-
151
-
152
-
153
-
154
-
155
-
156
-
157
-
158
-
159
-
160
-
161
-
162
-
163
-
164
-
165
-
166
-
167
-
168
-
169
-
170
-
171
-
172
-
173
-
174
-
175
-
176
-
177
-
178
-
179
-
180
-
181
-
182
-
183
-
184
-
185
-
186
-
187
-
188
-
189
-
190
-
191
-
192
-
193
-
194
-
195
-
196
-
197
-
198
-
199
-
200
-
201
-
202
-
203
-
204
-
205
-
206
-
207
-
208
-
209
-
210
-
211
-
212
-
213
-
214
-
215
-
216
-
217
-
218
-
219
-
220
-
221
-
222
-
223
-
224
-
225
-
226
-
227
-
228
-
229
-
230
-
231
-
232
-
233
-
234
-
235
-
236
-
237
-
238
-
239
-
240
-
241
-
242
-
243
-
244
-
245
-
246
-
247
-
248
-
249
-
250
-
251
-
252
-
253
-
254
-
255
-
256
-
257
-
258
-
259
-
260
-
261
-
262
-
263
-
264
-
265
-
266
-
267
-
268
-
269
-
270
-
271
-
272
-
273
-
274
-
275
-
276
-
277
-
278
-
279
-
280
-
281
-
282
-
283
-
284
-
285
-
286
-
287
-
288
-
289
-
290
-
291
-
292
-
293
-
294
-
295
-
296
-
297
-
298
-
299
-
300
-
301
-
302
-
303
-
304
-
305
-
306
-
307
-
308
-
309
-
310
-
311
-
312
-
313
-
314
-
315
-
316
-
317
-
318
-
319
-
320
-
321
-
322
-
323
-
324
-
325
-
326
-
327
-
328
-
329
-
330
-
331
-
332
-
333
-
334
-
335
-
336
-
337
-
338
-
339
-
340
-
341
-
342
-
343
-
344
-
345
-
346
-
347
-
348
-
349
-
350
-
351
-
352
-
353
-
354
-
355
-
356
-
357
-
358
-
359
-
360
-
361
-
362
-
363
-
364
-
365
-
366
-
367
-
368
-
369
-
370
-
371
-
372
-
373
-
374
-
375
-
376
-
377
-
378
-
379
-
380
-
381
-
382
-
383
-
384
-
385
-
386
-
387
-
388
-
389
-
390
-
391
-
392
-
393
-
394
-
395
-
396
-
397
-
398
-
399
-
400
-
401
-
402
-
403
-
404
-
405
-
406
-
407
-
408
-
409
-
410
-
411
-
412
-
413
-
414
-
415
-
416
-
417
-
418
-
419
-
420
-
421
-
422
-
423
-
424
 |
 |

3
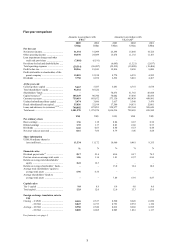
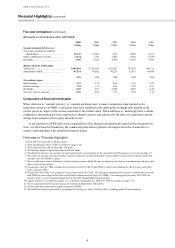
Five-year comparison
Amounts in accordance with
IFRSs8
Amounts in accordance with
UK GAAP9
2005 2004 2003 2002 2001
US$m US$m US$m US$m US$m
For the year
Net interest income .................................. 31,334 31,099 25,598 15,460 14,725
Other operating income ........................... 30,370 24,889 15,474 11,135 11,163
Loan impairment charges and other
credit risk provisions ........................... (7,801) (6,191) – – –
Provisions for bad and doubtful debts ..... –– (6,093) (1,321) (2,037)
Total operating expenses ......................... (29,514) (26,487) (22,532) (15,808) (15,404)
Profit before tax ....................................... 20,966 18,943 12,816 9,650 8,000
Profit attributable to shareholders of the
parent company ................................... 15,081 12,918 8,774 6,239 4,992
Dividends ................................................ 7,750 6,932 6,532 5,001 4,467
At the year-end
Called up share capital ............................ 5,667 5,587 5,481 4,741 4,678
Total shareholders’ equity ....................... 92,432 85,522–––
Shareholders’ funds ................................. –– 74,473 51,765 45,688
Capital resources10 .................................. 105,449 90,780 74,042 57,430 50,854
Customer accounts .................................. 739,419 693,072 573,130 495,438 449,991
Undated subordinated loan capital .......... 3,474 3,686 3,617 3,540 3,479
Dated subordinated loan capital .............. 35,856 32,914 17,580 14,831 12,001
Loans and advances to customers11,12 ...... 740,002 672,891 528,977 352,344 308,649
Total assets .............................................. 1,501,970 1,279,974 1,034,216 758,605 695,545
US$ US$ US$ US$ US$
Per ordinary share
Basic earnings ......................................... 1.36 1.18 0.84 0.67 0.54
Diluted earnings ...................................... 1.35 1.17 0.83 0.66 0.53
Dividends ................................................ 0.69 0.63 0.60 0.53 0.48
Net asset value at year-end ...................... 8.16 7.66 6.79 5.46 4.88
Share information
US$0.50 ordinary shares in
issue (millions)..................................... 11,334 11,172 10,960 9,481 9,355
%%%%%
Financial ratios
Dividend payout ratio13 ........................... 50.7 53.4 60.6 69.7 76.2
Post-tax return on average total assets ..... 1.06 1.14 1.01 0.97 0.86
Return on average total shareholders’
equity .................................................. 16.8 16.3–––
Return on average shareholders’ funds .... –– 13.0 12.4 10.6
Average total shareholders’ equity to
average total assets .............................. 5.96 6.35–––
Average shareholders’ funds to
average total assets .............................. ––7.066.916.87
Capital ratios
Tier 1 capital ........................................... 9.0 8.9 8.9 9.0 9.0
Total capital ............................................. 12.8 12.0 12.0 13.3 13.0
Foreign exchange translation rates to
US$
Closing – £:US$1 ................................... 0.581 0.517 0.560 0.620 0.690
– €:US$1 ................................... 0.847 0.733 0.793 0.953 1.130
Average – £:US$1 ................................... 0.550 0.546 0.612 0.666 0.695
– €:US$1 ................................... 0.805 0.805 0.885 1.061 1.117
For footnotes, see page 4.