HSBC 2005 Annual Report Download - page 80
Download and view the complete annual report
Please find page 80 of the 2005 HSBC annual report below. You can navigate through the pages in the report by either clicking on the pages listed below, or by using the keyword search tool below to find specific information within the annual report.-
 1
1 -
2
-
3
-
4
-
5
-
6
-
7
-
8
-
9
-
10
-
11
-
12
-
13
-
14
-
15
-
16
-
17
-
18
-
19
-
20
-
21
-
22
-
23
-
24
-
25
-
26
-
27
-
28
-
29
-
30
-
31
-
32
-
33
-
34
-
35
-
36
-
37
-
38
-
39
-
40
-
41
-
42
-
43
-
44
-
45
-
46
-
47
-
48
-
49
-
50
-
51
-
52
-
53
-
54
-
55
-
56
-
57
-
58
-
59
-
60
-
61
-
62
-
63
-
64
-
65
-
66
-
67
-
68
-
69
-
 70
70 -
 71
71 -
 72
72 -
 73
73 -
 74
74 -
 75
75 -
 76
76 -
 77
77 -
 78
78 -
 79
79 -
 80
80 -
 81
81 -
 82
82 -
 83
83 -
 84
84 -
 85
85 -
 86
86 -
 87
87 -
 88
88 -
 89
89 -
 90
90 -
91
-
92
-
93
-
94
-
95
-
96
-
97
-
98
-
99
-
100
-
101
-
102
-
103
-
104
-
105
-
106
-
107
-
108
-
109
-
110
-
111
-
112
-
113
-
114
-
115
-
116
-
117
-
118
-
119
-
120
-
121
-
122
-
123
-
124
-
125
-
126
-
127
-
128
-
129
-
130
-
131
-
132
-
133
-
134
-
135
-
136
-
137
-
138
-
139
-
140
-
141
-
142
-
143
-
144
-
145
-
146
-
147
-
148
-
149
-
150
-
151
-
152
-
153
-
154
-
155
-
156
-
157
-
158
-
159
-
160
-
161
-
162
-
163
-
164
-
165
-
166
-
167
-
168
-
169
-
170
-
171
-
172
-
173
-
174
-
175
-
176
-
177
-
178
-
179
-
180
-
181
-
182
-
183
-
184
-
185
-
186
-
187
-
188
-
189
-
190
-
191
-
192
-
193
-
194
-
195
-
196
-
197
-
198
-
199
-
200
-
201
-
202
-
203
-
204
-
205
-
206
-
207
-
208
-
209
-
210
-
211
-
212
-
213
-
214
-
215
-
216
-
217
-
218
-
219
-
220
-
221
-
222
-
223
-
224
-
225
-
226
-
227
-
228
-
229
-
230
-
231
-
232
-
233
-
234
-
235
-
236
-
237
-
238
-
239
-
240
-
241
-
242
-
243
-
244
-
245
-
246
-
247
-
248
-
249
-
250
-
251
-
252
-
253
-
254
-
255
-
256
-
257
-
258
-
259
-
260
-
261
-
262
-
263
-
264
-
265
-
266
-
267
-
268
-
269
-
270
-
271
-
272
-
273
-
274
-
275
-
276
-
277
-
278
-
279
-
280
-
281
-
282
-
283
-
284
-
285
-
286
-
287
-
288
-
289
-
290
-
291
-
292
-
293
-
294
-
295
-
296
-
297
-
298
-
299
-
300
-
301
-
302
-
303
-
304
-
305
-
306
-
307
-
308
-
309
-
310
-
311
-
312
-
313
-
314
-
315
-
316
-
317
-
318
-
319
-
320
-
321
-
322
-
323
-
324
-
325
-
326
-
327
-
328
-
329
-
330
-
331
-
332
-
333
-
334
-
335
-
336
-
337
-
338
-
339
-
340
-
341
-
342
-
343
-
344
-
345
-
346
-
347
-
348
-
349
-
350
-
351
-
352
-
353
-
354
-
355
-
356
-
357
-
358
-
359
-
360
-
361
-
362
-
363
-
364
-
365
-
366
-
367
-
368
-
369
-
370
-
371
-
372
-
373
-
374
-
375
-
376
-
377
-
378
-
379
-
380
-
381
-
382
-
383
-
384
-
385
-
386
-
387
-
388
-
389
-
390
-
391
-
392
-
393
-
394
-
395
-
396
-
397
-
398
-
399
-
400
-
401
-
402
-
403
-
404
-
405
-
406
-
407
-
408
-
409
-
410
-
411
-
412
-
413
-
414
-
415
-
416
-
417
-
418
-
419
-
420
-
421
-
422
-
423
-
424
 |
 |

HSBC HOLDINGS PLC
Financial Review (continued)
78
projects.
Global Transaction Banking revenues increased,
as payments and cash management benefited from an
increase in regional mandates which added to
average balances, together with a widening of deposit
spreads, notably in Singapore, India and Thailand.
In Global Markets, balance sheet management
and money market revenues fell, particularly in
Singapore and Japan, due to the effect of rising short-
term interest rates and a flattening of the yield curves.
Net fees increased by 17 per cent. In Global
Transaction Banking, the expansion in business
capabilities which took place in the latter part of
2004 drove an increase in volumes, with marked
improvements in Singapore, South Korea and India.
Revenues from the custody business increased
against the backdrop of rising local stock market
indices as investment sentiment in the region
improved. Additionally, securities services in India
generated higher business volumes, with assets under
custody growing by US$9 billion to US$34 billion.
In Singapore, fee income increased by 55 per cent,
reflecting an increase in revenues from securities
services activities as HSBC leveraged its relationship
strength and product capabilities to attract new
business.
In the Middle East, corporate lending and trade
finance activity generated higher customer volumes
as regional economies strengthened from an increase
in foreign investment, tourism and higher real estate
and oil prices. Global Investment Banking benefited
from the resulting demand for cross-border business,
with an increase in fees from advisory and project
and export finance services.
Income from trading activities increased, in part
due to higher revenues from foreign exchange and
structured derivatives driven by enhanced
distribution and expanded product capabilities. In
South Korea, volatility in the Korean won against the
US dollar encouraged strong customer flows in
foreign exchange. In Malaysia, a rise in customer
demand, following the move to a managed float for
the Malaysian ringgit, improved trading volumes in
foreign exchange. Global Markets in Taiwan
generated higher revenues, due to improved sales of
structured derivative products. Falling interest rates
in the Philippines resulted in favourable price
movements on government bond portfolios. In the
Middle East, HSBC’s enhanced capability in
structured transactions and greater focus on trading in
the regional currencies drove volumes higher in a
volatile market.
Gains from the disposal of the Group’s asset
management business in Australia added
US$8 million to other operating income.
Net recoveries on loan impairment charges were
marginally lower than in 2004.
Operating expenses increased by 21 per cent to
US$733 million, broadly in line with the growth in
operating income and reflecting higher performance-
related incentives. 2005 bore the first full-year effect
of the recruitment in 2004 of over 600 additional
staff, of which more than half were in Global
Transaction Banking. The upgrade of corporate and
support teams across the region within Corporate and
Institutional Banking resulted in some 280 additional
people. The cost base was further affected by
investment in HSBCnet and other technology costs
incurred to support business expansion.
Income from associates included increased
contribution from HSBC’s investments in Bank of
Communications and Industrial Bank, which were
acquired in 2004.
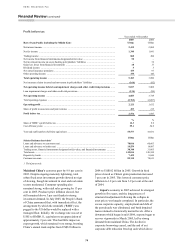
Private Banking reported a pre-tax profit of
US$78 million, an increase of 32 per cent compared
with 2004. Investment in the business over the past
two years was reflected in strong growth in client
assets and net new money inflows of US$2.3 billion,
against a backdrop of intense competition in the
region. Net operating income increased by 17 per
cent, predominantly due to higher trading income.
Net interest income fell by 29 per cent to
US$30 million compared with 2004. Balance sheet
growth was mainly in Singapore and Japan, where
client deposits increased by 44 and 64 per cent
respectively. Lending to customers also grew
strongly, with the loan book increasing by some
26 per cent. The net interest income benefits of these
were more than offset by lower treasury margins
earned in the rising interest rate environment, and the
reclassification under IFRSs from 1 January 2005 of
net interest income on certain derivatives to ‘net
trading income’.
Trading income increased by 62 per cent. Strong
growth in bond trading and sales of structured
products, which increased by 28 and 20 per cent
respectively, was compounded by the reclassification
from net interest income mentioned above. Fee
income was broadly in line with 2004, with the
benefit of growth in client assets largely offset by the
non-recurrence of exceptionally high brokerage
volumes driven by the market recovery last year.
Client assets increased by 23 per cent to
US$13.7 billion. Front office recruitment and
marketing campaigns, and inflows from the