HSBC 2005 Annual Report Download - page 93
Download and view the complete annual report
Please find page 93 of the 2005 HSBC annual report below. You can navigate through the pages in the report by either clicking on the pages listed below, or by using the keyword search tool below to find specific information within the annual report.-
 1
1 -
2
-
3
-
4
-
5
-
6
-
7
-
8
-
9
-
10
-
11
-
12
-
13
-
14
-
15
-
16
-
17
-
18
-
19
-
20
-
21
-
22
-
23
-
24
-
25
-
26
-
27
-
28
-
29
-
30
-
31
-
32
-
33
-
34
-
35
-
36
-
37
-
38
-
39
-
40
-
41
-
42
-
43
-
44
-
45
-
46
-
47
-
48
-
49
-
50
-
51
-
52
-
53
-
54
-
55
-
56
-
57
-
58
-
59
-
60
-
61
-
62
-
63
-
64
-
65
-
66
-
67
-
68
-
69
-
70
-
71
-
72
-
73
-
74
-
75
-
76
-
77
-
78
-
79
-
80
-
81
-
82
-
 83
83 -
 84
84 -
 85
85 -
 86
86 -
 87
87 -
 88
88 -
 89
89 -
 90
90 -
 91
91 -
 92
92 -
 93
93 -
 94
94 -
 95
95 -
 96
96 -
 97
97 -
 98
98 -
 99
99 -
 100
100 -
 101
101 -
 102
102 -
 103
103 -
104
-
105
-
106
-
107
-
108
-
109
-
110
-
111
-
112
-
113
-
114
-
115
-
116
-
117
-
118
-
119
-
120
-
121
-
122
-
123
-
124
-
125
-
126
-
127
-
128
-
129
-
130
-
131
-
132
-
133
-
134
-
135
-
136
-
137
-
138
-
139
-
140
-
141
-
142
-
143
-
144
-
145
-
146
-
147
-
148
-
149
-
150
-
151
-
152
-
153
-
154
-
155
-
156
-
157
-
158
-
159
-
160
-
161
-
162
-
163
-
164
-
165
-
166
-
167
-
168
-
169
-
170
-
171
-
172
-
173
-
174
-
175
-
176
-
177
-
178
-
179
-
180
-
181
-
182
-
183
-
184
-
185
-
186
-
187
-
188
-
189
-
190
-
191
-
192
-
193
-
194
-
195
-
196
-
197
-
198
-
199
-
200
-
201
-
202
-
203
-
204
-
205
-
206
-
207
-
208
-
209
-
210
-
211
-
212
-
213
-
214
-
215
-
216
-
217
-
218
-
219
-
220
-
221
-
222
-
223
-
224
-
225
-
226
-
227
-
228
-
229
-
230
-
231
-
232
-
233
-
234
-
235
-
236
-
237
-
238
-
239
-
240
-
241
-
242
-
243
-
244
-
245
-
246
-
247
-
248
-
249
-
250
-
251
-
252
-
253
-
254
-
255
-
256
-
257
-
258
-
259
-
260
-
261
-
262
-
263
-
264
-
265
-
266
-
267
-
268
-
269
-
270
-
271
-
272
-
273
-
274
-
275
-
276
-
277
-
278
-
279
-
280
-
281
-
282
-
283
-
284
-
285
-
286
-
287
-
288
-
289
-
290
-
291
-
292
-
293
-
294
-
295
-
296
-
297
-
298
-
299
-
300
-
301
-
302
-
303
-
304
-
305
-
306
-
307
-
308
-
309
-
310
-
311
-
312
-
313
-
314
-
315
-
316
-
317
-
318
-
319
-
320
-
321
-
322
-
323
-
324
-
325
-
326
-
327
-
328
-
329
-
330
-
331
-
332
-
333
-
334
-
335
-
336
-
337
-
338
-
339
-
340
-
341
-
342
-
343
-
344
-
345
-
346
-
347
-
348
-
349
-
350
-
351
-
352
-
353
-
354
-
355
-
356
-
357
-
358
-
359
-
360
-
361
-
362
-
363
-
364
-
365
-
366
-
367
-
368
-
369
-
370
-
371
-
372
-
373
-
374
-
375
-
376
-
377
-
378
-
379
-
380
-
381
-
382
-
383
-
384
-
385
-
386
-
387
-
388
-
389
-
390
-
391
-
392
-
393
-
394
-
395
-
396
-
397
-
398
-
399
-
400
-
401
-
402
-
403
-
404
-
405
-
406
-
407
-
408
-
409
-
410
-
411
-
412
-
413
-
414
-
415
-
416
-
417
-
418
-
419
-
420
-
421
-
422
-
423
-
424
 |
 |

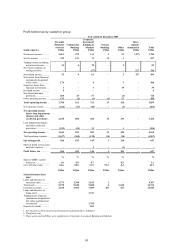
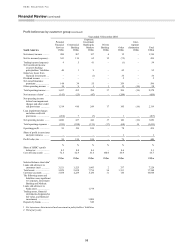
91
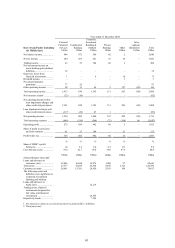
Year ended 31 December 2004
North America
Personal
Financial
Services
US$m
Commercial
Banking
US$m
Corporate,
Investment
Banking &
Markets
US$m
Private
Banking
US$m
Other
US$m
Inter-
segment
elimination
US$m
Total
US$m
Net interest
income/(expense) ......... 12,915 1,147 870 166 (105)
–
14,993
Net fee income/(expense) . 2,885 302 491 176 (89)
–
3,765
Trading income ................ 221 15 339 6 1
–
582
Gains less losses from
financial investments .... 80 5 68 6 1
–
160
Dividend income .............. 14
–
20
–
(2)
–
32
Net earned insurance
premiums ...................... 553
–
–
–
–
–
553
Other operating income .... (7) 154 129 4 1,065 (986) 359
Total operating income ..... 16,661 1,623 1,917 358 871 (986) 20,444
Net insurance claims1 ....... (312)
–
–
–
–
–
(312)
Net operating income
before loan impairment
charges and other credit
risk provisions .............. 16,349 1,623 1,917 358 871 (986) 20,132
Loan impairment charges
and other credit risk
provisions ..................... (5,120) 9 88 2 (1)
–
(5,022)
Net operating income ....... 11,229 1,632 2,005 360 870 (986) 15,110
Total operating expenses .. (6,845) (784) (1,024) (292) (1,073) 986 (9,032)
Operating profit/(loss) ...... 4,384 848 981 68 (203)
–
6,078
Share of profit/(loss) in
associates and joint
ventures ........................
–
–
(15)
–
7
–
(8)
Profit/(loss) before tax ...... 4,384 848 966 68 (196)
–
6,070
%%%%% %
Share of HSBC’s profit
before tax ..................... 23.1 4.5 5.1 0.3 (1.0) 32.0
Cost efficiency ratio .......... 41.9 48.3 53.4 81.6 123.2 44.9
US$m US$m US$m US$m US$m US$m
Selected balance sheet data2
Loans and advances to
customers (net) ............. 191,727 26,850 26,166 3,871 2 248,616
Total assets ....................... 228,451 31,407 106,713 4,538 74 371,183
Customer accounts ........... 51,165 27,167 46,745 7,822 1 132,900
The following assets and
liabilities were significant
to Corporate, Investment
Banking and Markets:
Loans and advances to
banks (net) .................... 23,817
Trading assets, financial
instruments designated at
fair value, and financial
investments .................. 46,700
Deposits by banks ............. 14,887
1Net insurance claims incurred and movement in policyholders’ liabilities.
2Third party only.