HSBC 2005 Annual Report Download - page 185
Download and view the complete annual report
Please find page 185 of the 2005 HSBC annual report below. You can navigate through the pages in the report by either clicking on the pages listed below, or by using the keyword search tool below to find specific information within the annual report.-
 1
1 -
2
-
3
-
4
-
5
-
6
-
7
-
8
-
9
-
10
-
11
-
12
-
13
-
14
-
15
-
16
-
17
-
18
-
19
-
20
-
21
-
22
-
23
-
24
-
25
-
26
-
27
-
28
-
29
-
30
-
31
-
32
-
33
-
34
-
35
-
36
-
37
-
38
-
39
-
40
-
41
-
42
-
43
-
44
-
45
-
46
-
47
-
48
-
49
-
50
-
51
-
52
-
53
-
54
-
55
-
56
-
57
-
58
-
59
-
60
-
61
-
62
-
63
-
64
-
65
-
66
-
67
-
68
-
69
-
70
-
71
-
72
-
73
-
74
-
75
-
76
-
77
-
78
-
79
-
80
-
81
-
82
-
83
-
84
-
85
-
86
-
87
-
88
-
89
-
90
-
91
-
92
-
93
-
94
-
95
-
96
-
97
-
98
-
99
-
100
-
101
-
102
-
103
-
104
-
105
-
106
-
107
-
108
-
109
-
110
-
111
-
112
-
113
-
114
-
115
-
116
-
117
-
118
-
119
-
120
-
121
-
122
-
123
-
124
-
125
-
126
-
127
-
128
-
129
-
130
-
131
-
132
-
133
-
134
-
135
-
136
-
137
-
138
-
139
-
140
-
141
-
142
-
143
-
144
-
145
-
146
-
147
-
148
-
149
-
150
-
151
-
152
-
153
-
154
-
155
-
156
-
157
-
158
-
159
-
160
-
161
-
162
-
163
-
164
-
165
-
166
-
167
-
168
-
169
-
170
-
171
-
172
-
173
-
174
-
 175
175 -
 176
176 -
 177
177 -
 178
178 -
 179
179 -
 180
180 -
 181
181 -
 182
182 -
 183
183 -
 184
184 -
 185
185 -
 186
186 -
 187
187 -
 188
188 -
 189
189 -
 190
190 -
 191
191 -
 192
192 -
 193
193 -
 194
194 -
 195
195 -
196
-
197
-
198
-
199
-
200
-
201
-
202
-
203
-
204
-
205
-
206
-
207
-
208
-
209
-
210
-
211
-
212
-
213
-
214
-
215
-
216
-
217
-
218
-
219
-
220
-
221
-
222
-
223
-
224
-
225
-
226
-
227
-
228
-
229
-
230
-
231
-
232
-
233
-
234
-
235
-
236
-
237
-
238
-
239
-
240
-
241
-
242
-
243
-
244
-
245
-
246
-
247
-
248
-
249
-
250
-
251
-
252
-
253
-
254
-
255
-
256
-
257
-
258
-
259
-
260
-
261
-
262
-
263
-
264
-
265
-
266
-
267
-
268
-
269
-
270
-
271
-
272
-
273
-
274
-
275
-
276
-
277
-
278
-
279
-
280
-
281
-
282
-
283
-
284
-
285
-
286
-
287
-
288
-
289
-
290
-
291
-
292
-
293
-
294
-
295
-
296
-
297
-
298
-
299
-
300
-
301
-
302
-
303
-
304
-
305
-
306
-
307
-
308
-
309
-
310
-
311
-
312
-
313
-
314
-
315
-
316
-
317
-
318
-
319
-
320
-
321
-
322
-
323
-
324
-
325
-
326
-
327
-
328
-
329
-
330
-
331
-
332
-
333
-
334
-
335
-
336
-
337
-
338
-
339
-
340
-
341
-
342
-
343
-
344
-
345
-
346
-
347
-
348
-
349
-
350
-
351
-
352
-
353
-
354
-
355
-
356
-
357
-
358
-
359
-
360
-
361
-
362
-
363
-
364
-
365
-
366
-
367
-
368
-
369
-
370
-
371
-
372
-
373
-
374
-
375
-
376
-
377
-
378
-
379
-
380
-
381
-
382
-
383
-
384
-
385
-
386
-
387
-
388
-
389
-
390
-
391
-
392
-
393
-
394
-
395
-
396
-
397
-
398
-
399
-
400
-
401
-
402
-
403
-
404
-
405
-
406
-
407
-
408
-
409
-
410
-
411
-
412
-
413
-
414
-
415
-
416
-
417
-
418
-
419
-
420
-
421
-
422
-
423
-
424
 |
 |

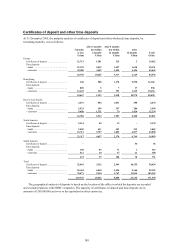
183
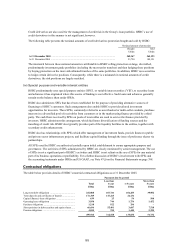
Credit derivatives are also used for the management of credit risk in the Group’s loan portfolio. HSBC’s use of
credit derivatives in this manner is not significant, however.
The following table presents the notional amounts of credit derivatives protection bought and sold by HSBC:
Notional amount of protection
Bought Sold
US$m US$m
At 31 December 2005 .......................................................................................................... 249,347 262,393
At 31 December 2004 ........................................................................................................... 93,750 102,321
The mismatch between these notional amounts is attributable to HSBC selling protection on large, diversified,
predominantly investment grade portfolios (including the most senior tranches) and then hedging these positions
by buying protection on the more subordinated tranches of the same portfolios. In addition, HSBC uses securities
to hedge certain derivative positions. Consequently, while there is a mismatch in notional amounts of credit
derivatives, the risk positions are largely matched.
(iv) Special purpose and variable interest entities
HSBC predominantly uses special purpose entities ('SPE'), or variable interest entities ('VIE'), to securitise loans
and advances it has originated where this source of funding is cost effective. Such loans and advances generally
remain on the balance sheet under IFRSs.
HSBC also administers SPEs that have been established for the purpose of providing alternative sources of
financing to HSBC’s customers. Such arrangements also enable HSBC to provide tailored investment
opportunities for investors. These SPEs, commonly referred to as asset-backed or multi-seller conduits, purchase
interests in a diversified pool of receivables from customers or in the market using finance provided by a third
party. The cash flows received by SPEs on pools of receivables are used to service the finance provided by
investors. HSBC administers this arrangement, which facilitates diversification of funding sources and the
tranching of credit risk. HSBC also typically provides part of the liquidity facilities to the entities, together with
secondary credit enhancement.
HSBC also has relationships with SPEs which offer management of investment funds, provide finance to public
and private sector infrastructure projects, and facilitate capital funding through the issue of preference shares via
partnerships.
All SPEs used by HSBC are authorised centrally upon initial establishment to ensure appropriate purpose and
governance. The activities of SPEs administered by HSBC are closely monitored by senior management. The use
of SPEs is not a significant part of HSBC’s activities and HSBC is not reliant on the use of SPEs for any material
part of its business operations or profitability. For a further discussion of HSBC’s involvement with SPEs and
the accounting treatments under IFRSs and US GAAP, see Note 47(j) on the Financial Statements on page 398.
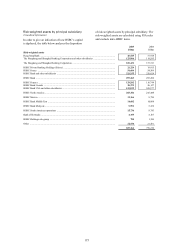
Contractual obligations
The table below provides details of HSBC’s material contractual obligations as at 31 December 2005.
Payments due by period
Total
Less than
1 year 1–5 years
More than
5 years
US$m US$m US$m US$m
Long-term debt obligations ......................................... 252,008 107,741 104,285 39,982
Term deposits and certificates of deposit ..................... 171,349 147,215 24,134 –
Capital (finance) lease obligations ............................... 639 25 54 560
Operating lease obligations ......................................... 3,950 744 1,754 1,452
Purchase obligations .................................................... 1,218 922 296 –
Short positions in debt securities and equity shares...... 66,696 55,491 3,687 7,518
Pension obligations ...................................................... 4,050 390 1,440 2,220
499,910 312,528 135,650 51,732