HSBC 2005 Annual Report Download - page 286
Download and view the complete annual report
Please find page 286 of the 2005 HSBC annual report below. You can navigate through the pages in the report by either clicking on the pages listed below, or by using the keyword search tool below to find specific information within the annual report.-
 1
1 -
2
-
3
-
4
-
5
-
6
-
7
-
8
-
9
-
10
-
11
-
12
-
13
-
14
-
15
-
16
-
17
-
18
-
19
-
20
-
21
-
22
-
23
-
24
-
25
-
26
-
27
-
28
-
29
-
30
-
31
-
32
-
33
-
34
-
35
-
36
-
37
-
38
-
39
-
40
-
41
-
42
-
43
-
44
-
45
-
46
-
47
-
48
-
49
-
50
-
51
-
52
-
53
-
54
-
55
-
56
-
57
-
58
-
59
-
60
-
61
-
62
-
63
-
64
-
65
-
66
-
67
-
68
-
69
-
70
-
71
-
72
-
73
-
74
-
75
-
76
-
77
-
78
-
79
-
80
-
81
-
82
-
83
-
84
-
85
-
86
-
87
-
88
-
89
-
90
-
91
-
92
-
93
-
94
-
95
-
96
-
97
-
98
-
99
-
100
-
101
-
102
-
103
-
104
-
105
-
106
-
107
-
108
-
109
-
110
-
111
-
112
-
113
-
114
-
115
-
116
-
117
-
118
-
119
-
120
-
121
-
122
-
123
-
124
-
125
-
126
-
127
-
128
-
129
-
130
-
131
-
132
-
133
-
134
-
135
-
136
-
137
-
138
-
139
-
140
-
141
-
142
-
143
-
144
-
145
-
146
-
147
-
148
-
149
-
150
-
151
-
152
-
153
-
154
-
155
-
156
-
157
-
158
-
159
-
160
-
161
-
162
-
163
-
164
-
165
-
166
-
167
-
168
-
169
-
170
-
171
-
172
-
173
-
174
-
175
-
176
-
177
-
178
-
179
-
180
-
181
-
182
-
183
-
184
-
185
-
186
-
187
-
188
-
189
-
190
-
191
-
192
-
193
-
194
-
195
-
196
-
197
-
198
-
199
-
200
-
201
-
202
-
203
-
204
-
205
-
206
-
207
-
208
-
209
-
210
-
211
-
212
-
213
-
214
-
215
-
216
-
217
-
218
-
219
-
220
-
221
-
222
-
223
-
224
-
225
-
226
-
227
-
228
-
229
-
230
-
231
-
232
-
233
-
234
-
235
-
236
-
237
-
238
-
239
-
240
-
241
-
242
-
243
-
244
-
245
-
246
-
247
-
248
-
249
-
250
-
251
-
252
-
253
-
254
-
255
-
256
-
257
-
258
-
259
-
260
-
261
-
262
-
263
-
264
-
265
-
266
-
267
-
268
-
269
-
270
-
271
-
272
-
273
-
274
-
275
-
 276
276 -
 277
277 -
 278
278 -
 279
279 -
 280
280 -
 281
281 -
 282
282 -
 283
283 -
 284
284 -
 285
285 -
 286
286 -
 287
287 -
 288
288 -
 289
289 -
 290
290 -
 291
291 -
 292
292 -
 293
293 -
 294
294 -
 295
295 -
 296
296 -
297
-
298
-
299
-
300
-
301
-
302
-
303
-
304
-
305
-
306
-
307
-
308
-
309
-
310
-
311
-
312
-
313
-
314
-
315
-
316
-
317
-
318
-
319
-
320
-
321
-
322
-
323
-
324
-
325
-
326
-
327
-
328
-
329
-
330
-
331
-
332
-
333
-
334
-
335
-
336
-
337
-
338
-
339
-
340
-
341
-
342
-
343
-
344
-
345
-
346
-
347
-
348
-
349
-
350
-
351
-
352
-
353
-
354
-
355
-
356
-
357
-
358
-
359
-
360
-
361
-
362
-
363
-
364
-
365
-
366
-
367
-
368
-
369
-
370
-
371
-
372
-
373
-
374
-
375
-
376
-
377
-
378
-
379
-
380
-
381
-
382
-
383
-
384
-
385
-
386
-
387
-
388
-
389
-
390
-
391
-
392
-
393
-
394
-
395
-
396
-
397
-
398
-
399
-
400
-
401
-
402
-
403
-
404
-
405
-
406
-
407
-
408
-
409
-
410
-
411
-
412
-
413
-
414
-
415
-
416
-
417
-
418
-
419
-
420
-
421
-
422
-
423
-
424
 |
 |

HSBC HOLDINGS PLC
Notes on the Financial Statements (continued)
284
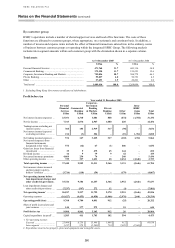
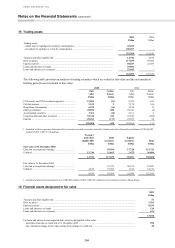
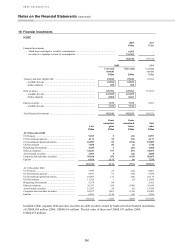
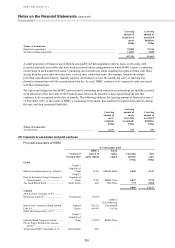
15 Trading assets
2005 2004
US$m US$m
Trading assets:
– which may be repledged or resold by counterparties ................................................................ 42,652 –
– not subject to repledge or resale by counterparties ................................................................... 190,257 –
232,909 122,160
Treasury and other eligible bills .................................................................................................. 12,746 4,816
Debt securities ............................................................................................................................. 117,659 95,308
Equity securities .......................................................................................................................... 20,203 22,036
Loans and advances to banks ...................................................................................................... 29,806 –
Loans and advances to customers.................................................................................................52,495 –
232,909 122,160
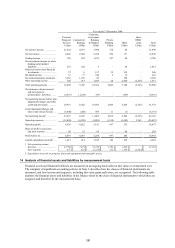
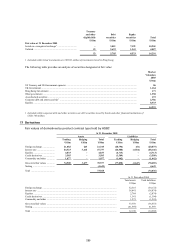
The following table provides an analysis of trading securities which are valued at fair value and the net unrealised
holding gains/(losses) included in this value:
2005 2004
Fair
value
Gains/
(losses)
Fair
value
Gains/
(losses)
US$m US$m US$m US$m
US Treasury and US Government agencies.................. 12,094 (21) 8,252 109
UK Government .......................................................... 3,225 2 7,170 164
Hong Kong Government .............................................. 6,529 (16) 5,190 12
Other government ........................................................ 49,852 280 29,541 (4)
Asset-backed securities ............................................... 3,361 (24) 2,161 2
Corporate debt and other securities1 ............................ 55,344 324 47,810 (204)
Equities ....................................................................... 20,203 (117) 22,036 92
150,608 428 122,160 171
1Included within corporate debt and other securities are debt securities issued by banks and other financial institutions of US$16,888
million (2004: US$19,516 million).
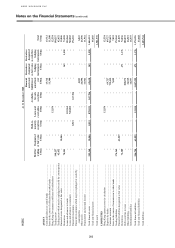
Treasury
and other
eligible bills
Debt
securities
Equity
securities Total
US$m US$m US$m US$m
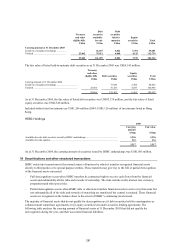
Fair value at 31 December 2005
Listed on a recognised exchange1 ................................ – 95,994 17,728 113,722
Unlisted ....................................................................... 12,746 21,665 2,475 36,886
12,746 117,659 20,203 150,608
Fair value at 31 December 2004
Listed on a recognised exchange1 ................................ – 67,725 20,122 87,847
Unlisted ....................................................................... 4,816 27,583 1,914 34,313
4,816 95,308 22,036 122,160
1Included within listed investments are US$2,049 million (2004: US$2,861 million) of investments listed in Hong Kong.
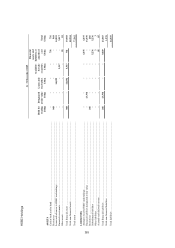
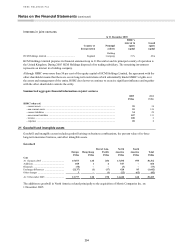
16 Financial assets designated at fair value
2005
US$m
Treasury and other eligible bills ...................................................................................................................................... 53
Debt securities ................................................................................................................................................................. 5,705
Equity securities .............................................................................................................................................................. 8,533
Loans and advances to banks .......................................................................................................................................... 124
Loans and advances to customers .................................................................................................................................... 631
15,046
For loans and advances and unquoted debt securities designated at fair value:
– maximum exposure to credit risk at 31 December 2005 ............................................................................................. 958
– the cumulative change in fair value arising from changes in credit risk ...................................................................... 28