HSBC 2005 Annual Report Download - page 139
Download and view the complete annual report
Please find page 139 of the 2005 HSBC annual report below. You can navigate through the pages in the report by either clicking on the pages listed below, or by using the keyword search tool below to find specific information within the annual report.-
 1
1 -
2
-
3
-
4
-
5
-
6
-
7
-
8
-
9
-
10
-
11
-
12
-
13
-
14
-
15
-
16
-
17
-
18
-
19
-
20
-
21
-
22
-
23
-
24
-
25
-
26
-
27
-
28
-
29
-
30
-
31
-
32
-
33
-
34
-
35
-
36
-
37
-
38
-
39
-
40
-
41
-
42
-
43
-
44
-
45
-
46
-
47
-
48
-
49
-
50
-
51
-
52
-
53
-
54
-
55
-
56
-
57
-
58
-
59
-
60
-
61
-
62
-
63
-
64
-
65
-
66
-
67
-
68
-
69
-
70
-
71
-
72
-
73
-
74
-
75
-
76
-
77
-
78
-
79
-
80
-
81
-
82
-
83
-
84
-
85
-
86
-
87
-
88
-
89
-
90
-
91
-
92
-
93
-
94
-
95
-
96
-
97
-
98
-
99
-
100
-
101
-
102
-
103
-
104
-
105
-
106
-
107
-
108
-
109
-
110
-
111
-
112
-
113
-
114
-
115
-
116
-
117
-
118
-
119
-
120
-
121
-
122
-
123
-
124
-
125
-
126
-
127
-
128
-
 129
129 -
 130
130 -
 131
131 -
 132
132 -
 133
133 -
 134
134 -
 135
135 -
 136
136 -
 137
137 -
 138
138 -
 139
139 -
 140
140 -
 141
141 -
 142
142 -
 143
143 -
 144
144 -
 145
145 -
 146
146 -
 147
147 -
 148
148 -
 149
149 -
150
-
151
-
152
-
153
-
154
-
155
-
156
-
157
-
158
-
159
-
160
-
161
-
162
-
163
-
164
-
165
-
166
-
167
-
168
-
169
-
170
-
171
-
172
-
173
-
174
-
175
-
176
-
177
-
178
-
179
-
180
-
181
-
182
-
183
-
184
-
185
-
186
-
187
-
188
-
189
-
190
-
191
-
192
-
193
-
194
-
195
-
196
-
197
-
198
-
199
-
200
-
201
-
202
-
203
-
204
-
205
-
206
-
207
-
208
-
209
-
210
-
211
-
212
-
213
-
214
-
215
-
216
-
217
-
218
-
219
-
220
-
221
-
222
-
223
-
224
-
225
-
226
-
227
-
228
-
229
-
230
-
231
-
232
-
233
-
234
-
235
-
236
-
237
-
238
-
239
-
240
-
241
-
242
-
243
-
244
-
245
-
246
-
247
-
248
-
249
-
250
-
251
-
252
-
253
-
254
-
255
-
256
-
257
-
258
-
259
-
260
-
261
-
262
-
263
-
264
-
265
-
266
-
267
-
268
-
269
-
270
-
271
-
272
-
273
-
274
-
275
-
276
-
277
-
278
-
279
-
280
-
281
-
282
-
283
-
284
-
285
-
286
-
287
-
288
-
289
-
290
-
291
-
292
-
293
-
294
-
295
-
296
-
297
-
298
-
299
-
300
-
301
-
302
-
303
-
304
-
305
-
306
-
307
-
308
-
309
-
310
-
311
-
312
-
313
-
314
-
315
-
316
-
317
-
318
-
319
-
320
-
321
-
322
-
323
-
324
-
325
-
326
-
327
-
328
-
329
-
330
-
331
-
332
-
333
-
334
-
335
-
336
-
337
-
338
-
339
-
340
-
341
-
342
-
343
-
344
-
345
-
346
-
347
-
348
-
349
-
350
-
351
-
352
-
353
-
354
-
355
-
356
-
357
-
358
-
359
-
360
-
361
-
362
-
363
-
364
-
365
-
366
-
367
-
368
-
369
-
370
-
371
-
372
-
373
-
374
-
375
-
376
-
377
-
378
-
379
-
380
-
381
-
382
-
383
-
384
-
385
-
386
-
387
-
388
-
389
-
390
-
391
-
392
-
393
-
394
-
395
-
396
-
397
-
398
-
399
-
400
-
401
-
402
-
403
-
404
-
405
-
406
-
407
-
408
-
409
-
410
-
411
-
412
-
413
-
414
-
415
-
416
-
417
-
418
-
419
-
420
-
421
-
422
-
423
-
424
 |
 |

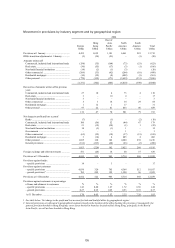
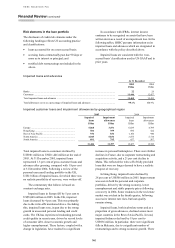
137
2002
Europe
Hong
Kong
Rest of
Asia-
Pacific
North
America
South
America Total
US$m US$m US$m US$m US$m US$m
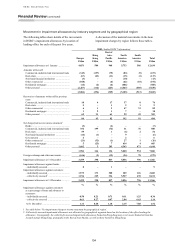
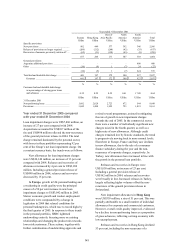
Provisions at 1 January ....................................... 3,067 1,408 1,952 723 1,033 8,183
Amounts written off
Banks ............................................................... ––––(1) (1)
Commercial, industrial and international trade (161) (59) (255) (92) (28) (595)
Real estate ....................................................... (31) (18) (88) (9) (4) (150)
Non-bank financial institutions ........................ (4) (11) (2) (12) (2) (31)
Governments ................................................... (1) ––––(1)
Other commercial ............................................ (54) (11) (116) (149) (22) (352)
Residential mortgages ..................................... (2) (109) (7) (2) (10) (130)
Other personal ................................................. (199) (328) (132) (96) (96) (851)
(452) (536) (600) (360) (163) (2,111)
Recoveries of amounts written off in previous
years
Commercial, industrial and international trade 15 1 4 6 2 28
Real estate ....................................................... 6 –26–14
Non-bank financial institutions ........................ ––1––1
Other commercial ............................................ 7 3 14 9 –33
Residential mortgages ..................................... 1 7 –––8
Other personal ................................................. 29 14 31 14 8 96
58 25 52 35 10 180
Net charge to profit and loss account1
Banks ............................................................... (2) ––––(2)
Commercial, industrial and international trade 345 (22) 38 89 30 480
Real estate ....................................................... (4) 9 (11) 5 2 1
Non-bank financial institutions ........................ 3 (14) (29) 18 11 (11)
Governments ................................................... (1) ––(5) 4 (2)
Other commercial ............................................ 50 (22) (22) 116 177 299
Residential mortgages ..................................... –70 11 (4) 10 87
Other personal ................................................. 243 322 93 66 96 820
General Provisions .......................................... (65) (97) 9 15 (213) (351)
569 246 89 300 117 1,321
Foreign exchange and other movements2 ............ 426 –3 1,658 (520) 1,567
Provisions at 31 December ................................. 3,668 1,143 1,496 2,356 477 9,140
Provisions against banks:
– specific provisions ........................................ 23 ––––23
Provisions against customers
– specific provisions ........................................ 2,774 688 1,321 1,482 341 6,606
– general provisions3 ....................................... 871 455 175 874 136 2,511
Provisions at 31 December ................................. 3,668 1,143 1,496 2,356 477 9,140
Provisions against customers as a percentage
of loans and advances to customers %%%%%%
– specific provisions ........................................ 1.65 0.97 3.42 1.85 9.73 1.83
– general provisions ......................................... 0.52 0.64 0.45 1.09 3.88 0.69
At 31 December .............................................. 2.17 1.61 3.87 2.94 13.61 2.52
1See table below ‘Net charge to the profit and loss account for bad and doubtful debts by geographical region’.
2Other movements include amounts transferred in on the acquisition of HSBC Mexico of US$1,704 million.
3General provisions are allocated to geographical segments based on the location of the office booking the provision. Consequently, the
general provision booked in Hong Kong may cover assets booked in branches located outside Hong Kong, principally in the Rest of
Asia-Pacific, as well as those booked in Hong Kong.