HSBC 2005 Annual Report Download - page 278
Download and view the complete annual report
Please find page 278 of the 2005 HSBC annual report below. You can navigate through the pages in the report by either clicking on the pages listed below, or by using the keyword search tool below to find specific information within the annual report.-
 1
1 -
2
-
3
-
4
-
5
-
6
-
7
-
8
-
9
-
10
-
11
-
12
-
13
-
14
-
15
-
16
-
17
-
18
-
19
-
20
-
21
-
22
-
23
-
24
-
25
-
26
-
27
-
28
-
29
-
30
-
31
-
32
-
33
-
34
-
35
-
36
-
37
-
38
-
39
-
40
-
41
-
42
-
43
-
44
-
45
-
46
-
47
-
48
-
49
-
50
-
51
-
52
-
53
-
54
-
55
-
56
-
57
-
58
-
59
-
60
-
61
-
62
-
63
-
64
-
65
-
66
-
67
-
68
-
69
-
70
-
71
-
72
-
73
-
74
-
75
-
76
-
77
-
78
-
79
-
80
-
81
-
82
-
83
-
84
-
85
-
86
-
87
-
88
-
89
-
90
-
91
-
92
-
93
-
94
-
95
-
96
-
97
-
98
-
99
-
100
-
101
-
102
-
103
-
104
-
105
-
106
-
107
-
108
-
109
-
110
-
111
-
112
-
113
-
114
-
115
-
116
-
117
-
118
-
119
-
120
-
121
-
122
-
123
-
124
-
125
-
126
-
127
-
128
-
129
-
130
-
131
-
132
-
133
-
134
-
135
-
136
-
137
-
138
-
139
-
140
-
141
-
142
-
143
-
144
-
145
-
146
-
147
-
148
-
149
-
150
-
151
-
152
-
153
-
154
-
155
-
156
-
157
-
158
-
159
-
160
-
161
-
162
-
163
-
164
-
165
-
166
-
167
-
168
-
169
-
170
-
171
-
172
-
173
-
174
-
175
-
176
-
177
-
178
-
179
-
180
-
181
-
182
-
183
-
184
-
185
-
186
-
187
-
188
-
189
-
190
-
191
-
192
-
193
-
194
-
195
-
196
-
197
-
198
-
199
-
200
-
201
-
202
-
203
-
204
-
205
-
206
-
207
-
208
-
209
-
210
-
211
-
212
-
213
-
214
-
215
-
216
-
217
-
218
-
219
-
220
-
221
-
222
-
223
-
224
-
225
-
226
-
227
-
228
-
229
-
230
-
231
-
232
-
233
-
234
-
235
-
236
-
237
-
238
-
239
-
240
-
241
-
242
-
243
-
244
-
245
-
246
-
247
-
248
-
249
-
250
-
251
-
252
-
253
-
254
-
255
-
256
-
257
-
258
-
259
-
260
-
261
-
262
-
263
-
264
-
265
-
266
-
267
-
 268
268 -
 269
269 -
 270
270 -
 271
271 -
 272
272 -
 273
273 -
 274
274 -
 275
275 -
 276
276 -
 277
277 -
 278
278 -
 279
279 -
 280
280 -
 281
281 -
 282
282 -
 283
283 -
 284
284 -
 285
285 -
 286
286 -
 287
287 -
 288
288 -
289
-
290
-
291
-
292
-
293
-
294
-
295
-
296
-
297
-
298
-
299
-
300
-
301
-
302
-
303
-
304
-
305
-
306
-
307
-
308
-
309
-
310
-
311
-
312
-
313
-
314
-
315
-
316
-
317
-
318
-
319
-
320
-
321
-
322
-
323
-
324
-
325
-
326
-
327
-
328
-
329
-
330
-
331
-
332
-
333
-
334
-
335
-
336
-
337
-
338
-
339
-
340
-
341
-
342
-
343
-
344
-
345
-
346
-
347
-
348
-
349
-
350
-
351
-
352
-
353
-
354
-
355
-
356
-
357
-
358
-
359
-
360
-
361
-
362
-
363
-
364
-
365
-
366
-
367
-
368
-
369
-
370
-
371
-
372
-
373
-
374
-
375
-
376
-
377
-
378
-
379
-
380
-
381
-
382
-
383
-
384
-
385
-
386
-
387
-
388
-
389
-
390
-
391
-
392
-
393
-
394
-
395
-
396
-
397
-
398
-
399
-
400
-
401
-
402
-
403
-
404
-
405
-
406
-
407
-
408
-
409
-
410
-
411
-
412
-
413
-
414
-
415
-
416
-
417
-
418
-
419
-
420
-
421
-
422
-
423
-
424
 |
 |

HSBC HOLDINGS PLC
Notes on the Financial Statements (continued)
276
2005 2004
US$m % US$m %
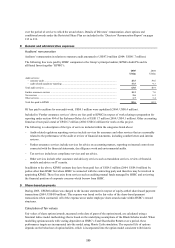
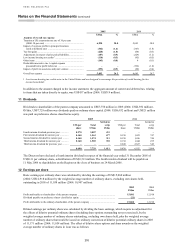
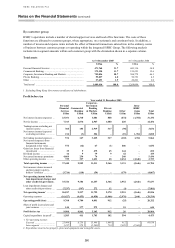
Analysis of overall tax expense
Taxation at UK corporation tax rate of 30 per cent
(2004: 30 per cent) ................................................................ 6,290 30.0 5,683 30.0
Impact of overseas profits in principal locations
taxed at different rates ........................................................... (342) (1.6) (347) (1.8)
Tax-free gains ............................................................................ (220) (1.0) (64) (0.3)
Adjustments in respect of prior period liabilities........................ (187) (0.9) (229) (1.2)
Low income housing tax credits1 ............................................... (110) (0.5) (95) (0.5)
Other items ................................................................................ (145) (0.8) 9 (0.1)
Deductible innovative tier 1 capital expense
presented below profit before tax .......................................... –– (192) (1.0)
Impact of profit in associates and joint ventures ....................... (193) (0.9) (80) (0.4)
Overall tax expense ................................................................... 5,093 24.3 4,685 24.7
1Low income housing tax credits arise in the United States and are designed to encourage the provision of rental housing for low
income households.
In addition to the amount charged to the income statement, the aggregate amount of current and deferred tax, relating
to items that are taken directly to equity, was US$437 million (2004: US$319 million).
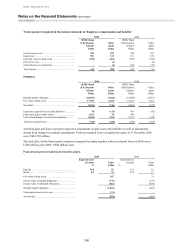
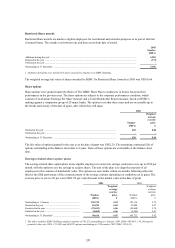
11 Dividends
Dividends to shareholders of the parent company amounted to US$7,750 million in 2005 (2004: US$6,932 million).
Of this, US$7,729 million was dividends paid on ordinary share capital (2004: US$6,932 million) and US$21 million
was paid on preference shares classified as equity.
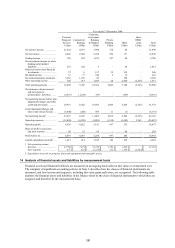
2005 2004
Total
Settled in
scrip Total
Settled in
scrip
US$ per
share US$m US$m
US$ per
share US$m US$m
Fourth interim dividend previous year ............. 0.270 3,007 431 –––
First interim dividend for current year .............. 0.140 1,563 677 0.130 1,425 747
Second interim dividend for current year ......... 0.140 1,574 311 0.130 1,436 746
Third interim dividend for current year ............ 0.140 1,585 392 0.130 1,444 255
Third interim dividend for previous year .......... –––0.240 2,627 346
0.690 7,729 1,811 0.630 6,932 2,094
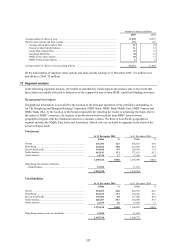
The Directors have declared a fourth interim dividend in respect of the financial year ended 31 December 2005 of
US$0.31 per ordinary share, a distribution of US$3,513 million. The fourth interim dividend will be payable on
11 May 2006 to shareholders on the Register at the close of business on 24 March 2006.
12 Earnings per share
Basic earnings per ordinary share was calculated by dividing the earnings of US$15,060 million
(2004: US$12,918 million) by the weighted average number of ordinary shares, excluding own shares held,
outstanding in 2005 of 11,038 million (2004: 10,907 million).
2005 2004
US$m US$m
Profit attributable to shareholders of the parent company .............................................................. 15,081 12,918
Dividend payable on preference shares classified as equity ........................................................... (21) –
Profit attributable to the ordinary shareholders of the parent company .......................................... 15,060 12,918
Diluted earnings per ordinary share was calculated by dividing the basic earnings, which require no adjustment for
the effects of dilutive potential ordinary shares (including share options outstanding not yet exercised), by the
weighted average number of ordinary shares outstanding, excluding own shares held, plus the weighted average
number of ordinary shares that would be issued on ordinary conversion of dilutive potential ordinary shares in 2005
of 11,171 million (2004: 11,054 million). The effect of dilutive share options and share awards on the weighted
average number of ordinary shares in issue was as follows: