HSBC 2005 Annual Report Download - page 138
Download and view the complete annual report
Please find page 138 of the 2005 HSBC annual report below. You can navigate through the pages in the report by either clicking on the pages listed below, or by using the keyword search tool below to find specific information within the annual report.-
 1
1 -
2
-
3
-
4
-
5
-
6
-
7
-
8
-
9
-
10
-
11
-
12
-
13
-
14
-
15
-
16
-
17
-
18
-
19
-
20
-
21
-
22
-
23
-
24
-
25
-
26
-
27
-
28
-
29
-
30
-
31
-
32
-
33
-
34
-
35
-
36
-
37
-
38
-
39
-
40
-
41
-
42
-
43
-
44
-
45
-
46
-
47
-
48
-
49
-
50
-
51
-
52
-
53
-
54
-
55
-
56
-
57
-
58
-
59
-
60
-
61
-
62
-
63
-
64
-
65
-
66
-
67
-
68
-
69
-
70
-
71
-
72
-
73
-
74
-
75
-
76
-
77
-
78
-
79
-
80
-
81
-
82
-
83
-
84
-
85
-
86
-
87
-
88
-
89
-
90
-
91
-
92
-
93
-
94
-
95
-
96
-
97
-
98
-
99
-
100
-
101
-
102
-
103
-
104
-
105
-
106
-
107
-
108
-
109
-
110
-
111
-
112
-
113
-
114
-
115
-
116
-
117
-
118
-
119
-
120
-
121
-
122
-
123
-
124
-
125
-
126
-
127
-
 128
128 -
 129
129 -
 130
130 -
 131
131 -
 132
132 -
 133
133 -
 134
134 -
 135
135 -
 136
136 -
 137
137 -
 138
138 -
 139
139 -
 140
140 -
 141
141 -
 142
142 -
 143
143 -
 144
144 -
 145
145 -
 146
146 -
 147
147 -
 148
148 -
149
-
150
-
151
-
152
-
153
-
154
-
155
-
156
-
157
-
158
-
159
-
160
-
161
-
162
-
163
-
164
-
165
-
166
-
167
-
168
-
169
-
170
-
171
-
172
-
173
-
174
-
175
-
176
-
177
-
178
-
179
-
180
-
181
-
182
-
183
-
184
-
185
-
186
-
187
-
188
-
189
-
190
-
191
-
192
-
193
-
194
-
195
-
196
-
197
-
198
-
199
-
200
-
201
-
202
-
203
-
204
-
205
-
206
-
207
-
208
-
209
-
210
-
211
-
212
-
213
-
214
-
215
-
216
-
217
-
218
-
219
-
220
-
221
-
222
-
223
-
224
-
225
-
226
-
227
-
228
-
229
-
230
-
231
-
232
-
233
-
234
-
235
-
236
-
237
-
238
-
239
-
240
-
241
-
242
-
243
-
244
-
245
-
246
-
247
-
248
-
249
-
250
-
251
-
252
-
253
-
254
-
255
-
256
-
257
-
258
-
259
-
260
-
261
-
262
-
263
-
264
-
265
-
266
-
267
-
268
-
269
-
270
-
271
-
272
-
273
-
274
-
275
-
276
-
277
-
278
-
279
-
280
-
281
-
282
-
283
-
284
-
285
-
286
-
287
-
288
-
289
-
290
-
291
-
292
-
293
-
294
-
295
-
296
-
297
-
298
-
299
-
300
-
301
-
302
-
303
-
304
-
305
-
306
-
307
-
308
-
309
-
310
-
311
-
312
-
313
-
314
-
315
-
316
-
317
-
318
-
319
-
320
-
321
-
322
-
323
-
324
-
325
-
326
-
327
-
328
-
329
-
330
-
331
-
332
-
333
-
334
-
335
-
336
-
337
-
338
-
339
-
340
-
341
-
342
-
343
-
344
-
345
-
346
-
347
-
348
-
349
-
350
-
351
-
352
-
353
-
354
-
355
-
356
-
357
-
358
-
359
-
360
-
361
-
362
-
363
-
364
-
365
-
366
-
367
-
368
-
369
-
370
-
371
-
372
-
373
-
374
-
375
-
376
-
377
-
378
-
379
-
380
-
381
-
382
-
383
-
384
-
385
-
386
-
387
-
388
-
389
-
390
-
391
-
392
-
393
-
394
-
395
-
396
-
397
-
398
-
399
-
400
-
401
-
402
-
403
-
404
-
405
-
406
-
407
-
408
-
409
-
410
-
411
-
412
-
413
-
414
-
415
-
416
-
417
-
418
-
419
-
420
-
421
-
422
-
423
-
424
 |
 |

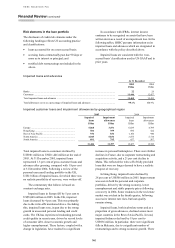
HSBC HOLDINGS PLC
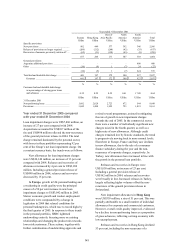
Financial Review (continued)
136
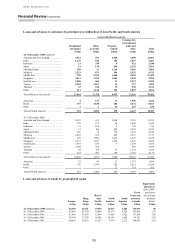
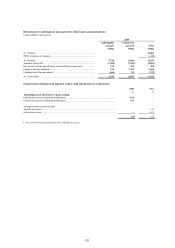
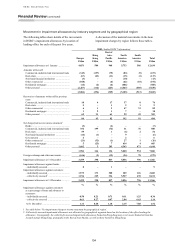
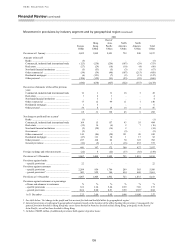
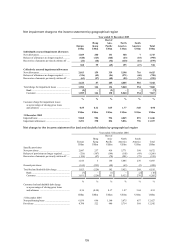
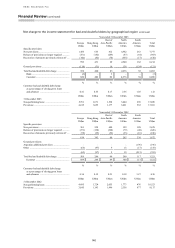
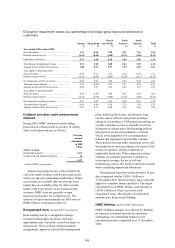
Movement in provisions by industry segment and by geographical region (continued)
2003
Europe
Hong
Kong
Rest of
Asia-
Pacific
North
America
South
America Total
US$m US$m US$m US$m US$m US$m
Provisions at 1 January ....................................... 3,668 1,143 1,496 2,356 477 9,140
Amounts written off
Commercial, industrial and international trade (338) (71) (201) (337) (69) (1,016)
Real estate ....................................................... (31) (12) (18) (113) (5) (179)
Non-bank financial institutions ....................... (3) (13) (21) (30) – (67)
Other commercial ........................................... (54) (65) (42) (104) (30) (295)
Residential mortgages ..................................... (4) (121) (16) (529) (5) (675)
Other personal ................................................. (472) (302) (147) (4,225) (78) (5,224)
(902) (584) (445) (5,338) (187) (7,456)
Recoveries of amounts written off in previous
years
Commercial, industrial and international trade 25 16 18 20 3 82
Real estate ....................................................... 3 – 4 2 – 9
Non-bank financial institutions ....................... 2 – 5 4 – 11
Other commercial ........................................... 49 4 11 10 7 81
Residential mortgages ..................................... 1 6 1 4 1 13
Other personal ................................................. 62 16 35 295 6 414
142 42 74 335 17 610
Net charge to profit and loss account1
Banks .............................................................. (6) – 3 – – (3)
Commercial, industrial and international trade 286 (3) (45) 78 60 376
Real estate ....................................................... 15 (18) (8) (1) 1 (11)
Non-bank financial institutions ....................... (1) 1 (17) (5) (1) (23)
Governments ................................................... – – 1 – – 1
Other commercial ........................................... 216 78 (4) 55 (6) 339
Residential mortgages ..................................... – 102 23 421 6 552
Other personal ................................................. 482 271 116 3,992 122 4,983
General Provisions .......................................... (118) (31) 16 136 (124) (121)
874 400 85 4,676 58 6,093
Foreign exchange and other movements2 ........... 653 54 (29) 4,432 218 5,328
Provisions at 31 December ................................. 4,435 1,055 1,181 6,461 583 13,715
Provisions against banks:
– specific provisions ....................................... 20 – 4 – – 24
Provisions against customers
– specific provisions ....................................... 3,554 629 981 5,184 530 10,878
– general provisions3 ....................................... 861 426 196 1,277 53 2,813
Provisions at 31 December ................................. 4,435 1,055 1,181 6,461 583 13,715
Provisions against customers as a percentage
of loans and advances to customers % % % % % %
– specific provisions ....................................... 1.65 0.84 1.99 2.62 9.46 2.00
– general provisions ........................................ 0.40 0.57 0.40 0.65 0.95 0.52
At 31 December ............................................. 2.05 1.41 2.39 3.27 10.41 2.52
1See table below ‘Net charge to the profit and loss account for bad and doubtful debts by geographical region’.
2Other movements include amounts of US$129 million in Europe and US$4,524 million in North America transferred in on the
acquisition of HSBC Finance Corporation, and of US$116 million in South America transferred in on the acquisition of Lloyds TSB
Group’s Brazilian businesses and assets.
3General provisions are allocated to geographical segments based on the location of the office booking the provision. Consequently, the
general provision booked in Hong Kong may cover assets booked in branches located outside Hong Kong, principally in the Rest of
Asia-Pacific, as well as those booked in Hong Kong.