HSBC 2005 Annual Report Download - page 71
Download and view the complete annual report
Please find page 71 of the 2005 HSBC annual report below. You can navigate through the pages in the report by either clicking on the pages listed below, or by using the keyword search tool below to find specific information within the annual report.-
 1
1 -
 2
2 -
 3
3 -
 4
4 -
 5
5 -
 6
6 -
 7
7 -
 8
8 -
 9
9 -
 10
10 -
 11
11 -
 12
12 -
 13
13 -
 14
14 -
 15
15 -
 16
16 -
 17
17 -
 18
18 -
 19
19 -
 20
20 -
 21
21 -
 22
22 -
 23
23 -
 24
24 -
 25
25 -
 26
26 -
 27
27 -
 28
28 -
 29
29 -
 30
30 -
 31
31 -
 32
32 -
 33
33 -
 34
34 -
 35
35 -
 36
36 -
 37
37 -
 38
38 -
 39
39 -
 40
40 -
 41
41 -
 42
42 -
 43
43 -
 44
44 -
 45
45 -
 46
46 -
 47
47 -
 48
48 -
 49
49 -
 50
50 -
 51
51 -
 52
52 -
 53
53 -
 54
54 -
 55
55 -
 56
56 -
 57
57 -
 58
58 -
 59
59 -
 60
60 -
 61
61 -
 62
62 -
 63
63 -
 64
64 -
 65
65 -
 66
66 -
 67
67 -
 68
68 -
 69
69 -
 70
70 -
 71
71 -
 72
72 -
 73
73 -
 74
74 -
 75
75 -
 76
76 -
 77
77 -
 78
78 -
 79
79 -
 80
80 -
 81
81 -
 82
82 -
 83
83 -
 84
84 -
 85
85 -
 86
86 -
 87
87 -
 88
88 -
 89
89 -
 90
90 -
 91
91 -
 92
92 -
 93
93 -
 94
94 -
 95
95 -
 96
96 -
 97
97 -
 98
98 -
 99
99 -
 100
100 -
 101
101 -
 102
102 -
 103
103 -
 104
104 -
 105
105 -
 106
106 -
 107
107 -
 108
108 -
 109
109 -
 110
110 -
 111
111 -
 112
112 -
 113
113 -
 114
114 -
 115
115 -
 116
116 -
 117
117 -
 118
118 -
 119
119 -
 120
120 -
 121
121 -
 122
122 -
 123
123 -
 124
124 -
 125
125 -
 126
126 -
 127
127 -
 128
128 -
 129
129 -
 130
130 -
 131
131 -
 132
132 -
 133
133 -
 134
134 -
 135
135 -
 136
136 -
 137
137 -
 138
138 -
 139
139 -
 140
140 -
 141
141 -
 142
142 -
 143
143 -
 144
144 -
 145
145 -
 146
146 -
 147
147 -
 148
148 -
 149
149 -
 150
150 -
 151
151 -
 152
152 -
 153
153 -
 154
154 -
 155
155 -
 156
156 -
 157
157 -
 158
158 -
 159
159 -
 160
160 -
 161
161 -
 162
162 -
 163
163 -
 164
164 -
 165
165 -
 166
166 -
 167
167 -
 168
168 -
 169
169 -
 170
170 -
 171
171 -
 172
172 -
 173
173 -
 174
174 -
 175
175 -
 176
176 -
 177
177 -
 178
178 -
 179
179 -
 180
180 -
 181
181 -
 182
182 -
 183
183 -
 184
184 -
 185
185 -
 186
186 -
 187
187 -
 188
188 -
 189
189 -
 190
190 -
 191
191 -
 192
192 -
 193
193 -
 194
194 -
 195
195 -
 196
196 -
 197
197 -
 198
198 -
 199
199 -
 200
200 -
 201
201 -
 202
202 -
 203
203 -
 204
204 -
 205
205 -
 206
206 -
 207
207 -
 208
208 -
 209
209 -
 210
210 -
 211
211 -
 212
212 -
 213
213 -
 214
214 -
 215
215 -
 216
216 -
 217
217 -
 218
218 -
 219
219 -
 220
220 -
 221
221 -
 222
222 -
 223
223 -
 224
224 -
 225
225 -
 226
226 -
 227
227 -
 228
228 -
 229
229 -
 230
230 -
 231
231 -
 232
232 -
 233
233 -
 234
234 -
 235
235 -
 236
236 -
 237
237 -
 238
238 -
 239
239 -
 240
240 -
 241
241 -
 242
242 -
 243
243 -
 244
244 -
 245
245 -
 246
246 -
 247
247 -
 248
248 -
 249
249 -
 250
250 -
 251
251 -
 252
252 -
 253
253 -
 254
254 -
 255
255 -
 256
256 -
 257
257 -
 258
258 -
 259
259 -
 260
260 -
 261
261 -
 262
262 -
 263
263 -
 264
264 -
 265
265 -
 266
266 -
 267
267 -
 268
268 -
 269
269 -
 270
270 -
 271
271 -
 272
272 -
 273
273 -
 274
274 -
 275
275 -
 276
276 -
 277
277 -
 278
278 -
 279
279 -
 280
280 -
 281
281 -
 282
282 -
 283
283 -
 284
284 -
 285
285 -
 286
286 -
 287
287 -
 288
288 -
 289
289 -
 290
290 -
 291
291 -
 292
292 -
 293
293 -
 294
294 -
 295
295 -
 296
296 -
 297
297 -
 298
298 -
 299
299 -
 300
300 -
 301
301 -
 302
302 -
 303
303 -
 304
304 -
 305
305 -
 306
306 -
 307
307 -
 308
308 -
 309
309 -
 310
310 -
 311
311 -
 312
312 -
 313
313 -
 314
314 -
 315
315 -
 316
316 -
 317
317 -
 318
318 -
 319
319 -
 320
320 -
 321
321 -
 322
322 -
 323
323 -
 324
324 -
 325
325 -
 326
326 -
 327
327 -
 328
328 -
 329
329 -
 330
330 -
 331
331 -
 332
332 -
 333
333 -
 334
334 -
 335
335 -
 336
336 -
 337
337 -
 338
338 -
 339
339 -
 340
340 -
 341
341 -
 342
342 -
 343
343 -
 344
344 -
 345
345 -
 346
346 -
 347
347 -
 348
348 -
 349
349 -
 350
350 -
 351
351 -
 352
352 -
 353
353 -
 354
354 -
 355
355 -
 356
356 -
 357
357 -
 358
358 -
 359
359 -
 360
360 -
 361
361 -
 362
362 -
 363
363 -
 364
364 -
 365
365 -
 366
366 -
 367
367 -
 368
368 -
 369
369 -
 370
370 -
 371
371 -
 372
372 -
 373
373 -
 374
374 -
 375
375 -
 376
376 -
 377
377 -
 378
378 -
 379
379 -
 380
380 -
 381
381 -
 382
382 -
 383
383 -
 384
384 -
 385
385 -
 386
386 -
 387
387 -
 388
388 -
 389
389 -
 390
390 -
 391
391 -
 392
392 -
 393
393 -
 394
394 -
 395
395 -
 396
396 -
 397
397 -
 398
398 -
 399
399 -
 400
400 -
 401
401 -
 402
402 -
 403
403 -
 404
404 -
 405
405 -
 406
406 -
 407
407 -
 408
408 -
 409
409 -
 410
410 -
 411
411 -
 412
412 -
 413
413 -
 414
414 -
 415
415 -
 416
416 -
 417
417 -
 418
418 -
 419
419 -
 420
420 -
 421
421 -
 422
422 -
 423
423 -
 424
424
 |
 |
69
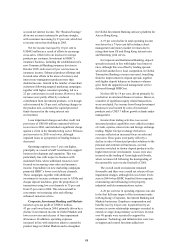
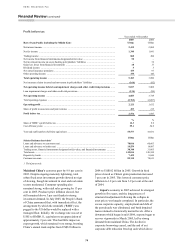
account net interest income. The ‘BusinessVantage’
all-in-one account continued to perform strongly,
with customers increasing by 23 per cent, which led
to income more than doubling in 2005.
Net fee income increased by 10 per cent to
US$402 million as a result of efforts to encourage
cross-sales, which led to an increase in average
products per customer. Investment in HSBC’s
insurance business, including the establishment of a
new Commercial Banking insurance division in
October 2005, delivered a 10 per cent increase in
insurance income. Enhanced product offerings and
focused sales efforts in the areas of currency and
interest rate management products more than
doubled income. Growth in the number of merchant
customers following targeted marketing campaigns,
together with higher consumer spending, led to a
22 per cent increase in card income. However, these
increases were partly offset by a reduced
contribution from investment products, even though
sales increased by 20 per cent, reflecting changes in
the product mix, as demand for capital protected
funds decreased in the rising interest rate
environment.
Loan impairment charges and other credit risk
provisions of US$168 million contrasted with net
recoveries in 2004, and included a significant charge
against a client in the manufacturing sector. Releases
and recoveries in 2005 were lower, although
impaired loans as a proportion of lending balances
decreased.
Operating expenses were 3 per cent higher,
principally as a result of staff recruitment to support
business development and expansion. This was
particularly true with respect to business with
mainland China, where additional resources were
focused on increasing cross-sales and insurance
income. Expenditure on new marketing campaigns
promoted HSBC’s lower-cost delivery channels.
These campaigns, together with additional
investment to increase customer access to ATMs and
cheque deposit machines, grew the proportion of
transactions using low cost channels to 35 per cent
from 25 per cent in 2004. This released staff to
concentrate on increasing sales and offering
enhanced customer service.
Corporate, Investment Banking and Markets
reported a pre-tax profit of US$922 million,
43 per cent lower than in 2004, primarily driven by a
decline in net interest income in Global Markets and
lower recoveries and releases of loan impairment
allowances. In addition, operating expenses
increased in line with initiatives taken to extend the
product range in Global Markets and to strengthen
the Global Investment Banking advisory platform for
Asia in Hong Kong.
A 19 per cent decline in total operating income
was driven by a 74 per cent fall in balance sheet
management and money market revenues due to
rising short-term US and Hong Kong interest rates
and flattening yield curves.
In Corporate and Institutional Banking, deposit
spreads increased in line with higher local interest
rates, although this was offset by lending spreads
which fell amidst fierce local competition. In Global
Transaction Banking revenues increased, benefiting
from the improvement in deposit spreads, together
with higher deposit balances as business volumes
grew from the upgraded cash management service
delivered through HSBCnet.
Net fees fell by 19 per cent, driven primarily by
a reduction in structured finance revenues. However,
a number of significant equity related transactions
were concluded. Fee income from Group Investment
Businesses was boosted by sales of investment
products and a US$3.7 billion growth in funds under
management.
Income from trading activities rose as new
structured product capabilities were added in respect
of credit, equities, interest rate and foreign exchange
trading. Higher foreign exchange derivatives
revenues reflected an increased focus on sales and
execution. These gains were partly offset by a
decline in sales of structured product solutions to the
personal and commercial businesses, as retail
investors switched to shorter deposit products in the
higher interest rate environment. Losses were also
incurred on the trading of Asian high-yield bonds,
where revenues fell following the downgrading of
the automobile sector in the first half of 2005.
The overall credit environment remained
favourable and there was a small net release of loan
impairment charges, although this was below levels
seen in 2004 when HSBC benefited from corporate
restructuring and refinancing in the property,
industrial and telecommunications sectors.
A 20 per cent rise in operating expenses was due
to the first full-year impact of the investment made
in Hong Kong’s Corporate, Investment Banking and
Markets businesses. Employee compensation and
benefits rose by 24 per cent, in part driven by an
increase in senior relationship managers recruited to
extend coverage along industry sector lines. In total,
over 90 people were recruited to support the
expansion. Technology and infrastructure costs rose
as support and control functions added new
