HSBC 2005 Annual Report Download - page 78
Download and view the complete annual report
Please find page 78 of the 2005 HSBC annual report below. You can navigate through the pages in the report by either clicking on the pages listed below, or by using the keyword search tool below to find specific information within the annual report.-
 1
1 -
2
-
3
-
4
-
5
-
6
-
7
-
8
-
9
-
10
-
11
-
12
-
13
-
14
-
15
-
16
-
17
-
18
-
19
-
20
-
21
-
22
-
23
-
24
-
25
-
26
-
27
-
28
-
29
-
30
-
31
-
32
-
33
-
34
-
35
-
36
-
37
-
38
-
39
-
40
-
41
-
42
-
43
-
44
-
45
-
46
-
47
-
48
-
49
-
50
-
51
-
52
-
53
-
54
-
55
-
56
-
57
-
58
-
59
-
60
-
61
-
62
-
63
-
64
-
65
-
66
-
67
-
 68
68 -
 69
69 -
 70
70 -
 71
71 -
 72
72 -
 73
73 -
 74
74 -
 75
75 -
 76
76 -
 77
77 -
 78
78 -
 79
79 -
 80
80 -
 81
81 -
 82
82 -
 83
83 -
 84
84 -
 85
85 -
 86
86 -
 87
87 -
 88
88 -
89
-
90
-
91
-
92
-
93
-
94
-
95
-
96
-
97
-
98
-
99
-
100
-
101
-
102
-
103
-
104
-
105
-
106
-
107
-
108
-
109
-
110
-
111
-
112
-
113
-
114
-
115
-
116
-
117
-
118
-
119
-
120
-
121
-
122
-
123
-
124
-
125
-
126
-
127
-
128
-
129
-
130
-
131
-
132
-
133
-
134
-
135
-
136
-
137
-
138
-
139
-
140
-
141
-
142
-
143
-
144
-
145
-
146
-
147
-
148
-
149
-
150
-
151
-
152
-
153
-
154
-
155
-
156
-
157
-
158
-
159
-
160
-
161
-
162
-
163
-
164
-
165
-
166
-
167
-
168
-
169
-
170
-
171
-
172
-
173
-
174
-
175
-
176
-
177
-
178
-
179
-
180
-
181
-
182
-
183
-
184
-
185
-
186
-
187
-
188
-
189
-
190
-
191
-
192
-
193
-
194
-
195
-
196
-
197
-
198
-
199
-
200
-
201
-
202
-
203
-
204
-
205
-
206
-
207
-
208
-
209
-
210
-
211
-
212
-
213
-
214
-
215
-
216
-
217
-
218
-
219
-
220
-
221
-
222
-
223
-
224
-
225
-
226
-
227
-
228
-
229
-
230
-
231
-
232
-
233
-
234
-
235
-
236
-
237
-
238
-
239
-
240
-
241
-
242
-
243
-
244
-
245
-
246
-
247
-
248
-
249
-
250
-
251
-
252
-
253
-
254
-
255
-
256
-
257
-
258
-
259
-
260
-
261
-
262
-
263
-
264
-
265
-
266
-
267
-
268
-
269
-
270
-
271
-
272
-
273
-
274
-
275
-
276
-
277
-
278
-
279
-
280
-
281
-
282
-
283
-
284
-
285
-
286
-
287
-
288
-
289
-
290
-
291
-
292
-
293
-
294
-
295
-
296
-
297
-
298
-
299
-
300
-
301
-
302
-
303
-
304
-
305
-
306
-
307
-
308
-
309
-
310
-
311
-
312
-
313
-
314
-
315
-
316
-
317
-
318
-
319
-
320
-
321
-
322
-
323
-
324
-
325
-
326
-
327
-
328
-
329
-
330
-
331
-
332
-
333
-
334
-
335
-
336
-
337
-
338
-
339
-
340
-
341
-
342
-
343
-
344
-
345
-
346
-
347
-
348
-
349
-
350
-
351
-
352
-
353
-
354
-
355
-
356
-
357
-
358
-
359
-
360
-
361
-
362
-
363
-
364
-
365
-
366
-
367
-
368
-
369
-
370
-
371
-
372
-
373
-
374
-
375
-
376
-
377
-
378
-
379
-
380
-
381
-
382
-
383
-
384
-
385
-
386
-
387
-
388
-
389
-
390
-
391
-
392
-
393
-
394
-
395
-
396
-
397
-
398
-
399
-
400
-
401
-
402
-
403
-
404
-
405
-
406
-
407
-
408
-
409
-
410
-
411
-
412
-
413
-
414
-
415
-
416
-
417
-
418
-
419
-
420
-
421
-
422
-
423
-
424
 |
 |

HSBC HOLDINGS PLC
Financial Review (continued)
76
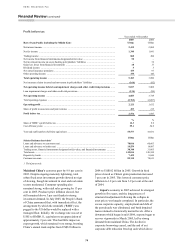
6.3 million, representing an increase of 34 per cent
over 2004. In India, the number of cards in
circulation exceeded one million for the first time.
Higher card balances led to higher net interest
income in Indonesia, India, Taiwan, Malaysia and the
Philippines.
Net fee income grew by 46 per cent to
US$419 million, largely attributable to strong sales
of investment and insurance products, and increased
account service fees. Credit card fee incomes rose,
driven by the strong growth in cardholder spending.
Commissions from sales of unit trusts and funds
under management were particularly strong in
Singapore, India and Taiwan. Sales of investment
products, comprising unit trusts, bonds and structured
notes, grew by 43 per cent to US$6.5 billion,
generating a 56 per cent increase in fee income. The
launch of over 217 tranches of structured notes and
deposit products in 11 countries across the region
achieved total sales of US$952 million. Total funds
under management rose by 33 per cent or
US$7.2 billion, led by increased marketing activity
and the considerable focus placed on wealth
management services during the year. HSBC Bank
Malaysia maintained its position as the leading
international institutional unit trust agent in the
country. Brokerage and custody fees grew,
particularly in Australia, where a 13 per cent rise
reflected increased stock market activity.
HSBC continued to emphasise the expansion of
its insurance business across the region. The number
of policies in force increased by 27 per cent and
revenues grew by 16 per cent.
Loan impairment charges and other credit risk
provisions doubled compared with 2004. This was
due to the non-recurrence of a release of a general
provision in Malaysia in 2004, and a sharp rise in
credit card provisions in Taiwan, reflecting
deteriorating credit conditions. Growth in personal
unsecured lending and credit cards across the region
contributed further to the increased charge.
Operating expenses increased by 29 per cent to
US$1,245 million in support of business growth.
HSBC spent considerable amounts in the region
enhancing its existing infrastructure in order to
benefit fully from the opportunities presented by the
Asian growth economies. Staff costs of
US$469 million rose by 23 per cent, as employee
numbers increased to support business growth and to
increase sales and wealth management activities.
Performance-related remuneration costs were also
higher as a result of the strong growth in profitability.
Marketing costs rose as major campaigns were
run to support product promotions in mortgages,
credit cards, insurance and investment products.
Continued emphasis was placed on brand awareness
in order to generate additional business and reinforce
HSBC’s position as the world’s local bank across the
region, and this further increased costs. Various
growth initiatives required investment in technology,
and the development of new distribution channels
resulted in higher IT costs. Other expenses, including
professional fees and communications costs, rose in
support of business expansion.
Increased contributions from HSBC’s
investments in Bank of Communications and
Industrial Bank in mainland China, together with
record earnings from The Saudi British Bank,
contributed to strong growth in profit from
associates.
Commercial Banking reported a pre-tax profit
of US$818 million, 45 per cent higher than that
delivered in 2004. The increase was mainly due to
higher net interest income as growth in customer
numbers and strong credit demand to fund
infrastructure investment drove balance sheet growth.
Higher contributions from Bank of Communications
and Industrial Bank in China, as well as a strong
performance in The Saudi British Bank, produced
higher income from associates. Lending balances
increased by 16 per cent, exceeded by a 24 per cent
rise in deposits.
Net interest income increased by 33 per cent to
US$631 million, reflecting growth in the Middle
East, Singapore, mainland China, Indonesia and
Taiwan. In the Middle East, strong regional
economies and significant government backed
infrastructure and property projects, principally in the
United Arab Emirates, contributed to a 37 per cent
growth in lending balances and a 42 per cent increase
in customer account balances. Higher trade flows
generated a 25 per cent increase in net interest
income from trade services, while higher interest
rates raised liability spreads by 118 basis points. A
new Amanah term investment product was launched
in May 2005, attracting US$120 million of deposits,
principally from new customers seeking Shariah-
compliant investment opportunities.
In mainland China, strong economic growth,
expansion of the branch network and the recruitment
of additional sales staff resulted in a 39 per cent
increase in lending balances. Deposit balances also
benefited from economic growth, increasing by
38 per cent, while deposit spreads widened by
76 basis points following increases in US interest
rates.
In Singapore, interest rate rises prompted
increased demand for savings products and