HSBC 2005 Annual Report Download - page 244
Download and view the complete annual report
Please find page 244 of the 2005 HSBC annual report below. You can navigate through the pages in the report by either clicking on the pages listed below, or by using the keyword search tool below to find specific information within the annual report.-
 1
1 -
2
-
3
-
4
-
5
-
6
-
7
-
8
-
9
-
10
-
11
-
12
-
13
-
14
-
15
-
16
-
17
-
18
-
19
-
20
-
21
-
22
-
23
-
24
-
25
-
26
-
27
-
28
-
29
-
30
-
31
-
32
-
33
-
34
-
35
-
36
-
37
-
38
-
39
-
40
-
41
-
42
-
43
-
44
-
45
-
46
-
47
-
48
-
49
-
50
-
51
-
52
-
53
-
54
-
55
-
56
-
57
-
58
-
59
-
60
-
61
-
62
-
63
-
64
-
65
-
66
-
67
-
68
-
69
-
70
-
71
-
72
-
73
-
74
-
75
-
76
-
77
-
78
-
79
-
80
-
81
-
82
-
83
-
84
-
85
-
86
-
87
-
88
-
89
-
90
-
91
-
92
-
93
-
94
-
95
-
96
-
97
-
98
-
99
-
100
-
101
-
102
-
103
-
104
-
105
-
106
-
107
-
108
-
109
-
110
-
111
-
112
-
113
-
114
-
115
-
116
-
117
-
118
-
119
-
120
-
121
-
122
-
123
-
124
-
125
-
126
-
127
-
128
-
129
-
130
-
131
-
132
-
133
-
134
-
135
-
136
-
137
-
138
-
139
-
140
-
141
-
142
-
143
-
144
-
145
-
146
-
147
-
148
-
149
-
150
-
151
-
152
-
153
-
154
-
155
-
156
-
157
-
158
-
159
-
160
-
161
-
162
-
163
-
164
-
165
-
166
-
167
-
168
-
169
-
170
-
171
-
172
-
173
-
174
-
175
-
176
-
177
-
178
-
179
-
180
-
181
-
182
-
183
-
184
-
185
-
186
-
187
-
188
-
189
-
190
-
191
-
192
-
193
-
194
-
195
-
196
-
197
-
198
-
199
-
200
-
201
-
202
-
203
-
204
-
205
-
206
-
207
-
208
-
209
-
210
-
211
-
212
-
213
-
214
-
215
-
216
-
217
-
218
-
219
-
220
-
221
-
222
-
223
-
224
-
225
-
226
-
227
-
228
-
229
-
230
-
231
-
232
-
233
-
 234
234 -
 235
235 -
 236
236 -
 237
237 -
 238
238 -
 239
239 -
 240
240 -
 241
241 -
 242
242 -
 243
243 -
 244
244 -
 245
245 -
 246
246 -
 247
247 -
 248
248 -
 249
249 -
 250
250 -
 251
251 -
 252
252 -
 253
253 -
 254
254 -
255
-
256
-
257
-
258
-
259
-
260
-
261
-
262
-
263
-
264
-
265
-
266
-
267
-
268
-
269
-
270
-
271
-
272
-
273
-
274
-
275
-
276
-
277
-
278
-
279
-
280
-
281
-
282
-
283
-
284
-
285
-
286
-
287
-
288
-
289
-
290
-
291
-
292
-
293
-
294
-
295
-
296
-
297
-
298
-
299
-
300
-
301
-
302
-
303
-
304
-
305
-
306
-
307
-
308
-
309
-
310
-
311
-
312
-
313
-
314
-
315
-
316
-
317
-
318
-
319
-
320
-
321
-
322
-
323
-
324
-
325
-
326
-
327
-
328
-
329
-
330
-
331
-
332
-
333
-
334
-
335
-
336
-
337
-
338
-
339
-
340
-
341
-
342
-
343
-
344
-
345
-
346
-
347
-
348
-
349
-
350
-
351
-
352
-
353
-
354
-
355
-
356
-
357
-
358
-
359
-
360
-
361
-
362
-
363
-
364
-
365
-
366
-
367
-
368
-
369
-
370
-
371
-
372
-
373
-
374
-
375
-
376
-
377
-
378
-
379
-
380
-
381
-
382
-
383
-
384
-
385
-
386
-
387
-
388
-
389
-
390
-
391
-
392
-
393
-
394
-
395
-
396
-
397
-
398
-
399
-
400
-
401
-
402
-
403
-
404
-
405
-
406
-
407
-
408
-
409
-
410
-
411
-
412
-
413
-
414
-
415
-
416
-
417
-
418
-
419
-
420
-
421
-
422
-
423
-
424
 |
 |

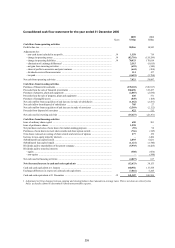
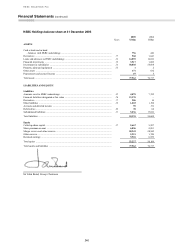
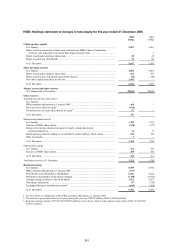
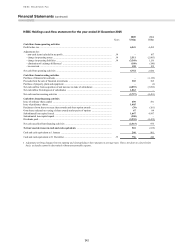
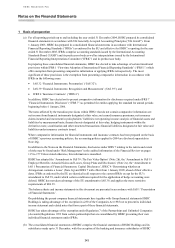
HSBC HOLDINGS PLC
Financial Statements (continued)
242
HSBC Holdings cash flow statement for the year ended 31 December 2005
2005 2004
Notes US$m US$m
Cash flows from operating activities
Profit before tax ........................................................................................................................ 6,541 4,495
Adjustments for:
– non-cash items included in net profit ................................................................................. 39 –167
– change in operating assets ................................................................................................. 39 2,511 (2,883)
– change in operating liabilities ............................................................................................ 39 (3,349) 1,156
– elimination of exchange differences1 ................................................................................. (109) (240)
– tax received ....................................................................................................................... 158 125
Net cash from operating activities ............................................................................................ 5,752 2,820
Cash flows from investing activities
Purchase of financial investments ............................................................................................. –(1,119)
Proceeds from the sale of financial investments ....................................................................... 303 365
Purchase of property, plant and equipment ............................................................................... –(1)
Net cash outflow from acquisition of and increase in stake of subsidiaries .............................. (4,093) (3,696)
Net cash inflow from disposal of subsidiaries .......................................................................... 1,063 –
Net cash used in investing activities ......................................................................................... (2,727) (4,451)
Cash flows from financing activities
Issue of ordinary share capital .................................................................................................. 690 581
Issue of preference shares ......................................................................................................... 1,405 –
Purchases of own shares to meet share awards and share option awards .................................. (39) (261)
Own shares released on vesting of share awards and exercise of options ................................. 67 84
Subordinated loan capital issued ...............................................................................................1,647 4,997
Subordinated loan capital repaid ...............................................................................................(350) –
Dividends paid .......................................................................................................................... (5,935) (4,425)
Net cash (used in)/from financing activities ............................................................................. (2,515) 976
Net increase/(decrease) in cash and cash equivalents .......................................................... 510 (655)
Cash and cash equivalents at 1 January .................................................................................... 246 901
Cash and cash equivalents at 31 December ............................................................................... 39 756 246
1Adjustment to bring changes between opening and closing balance sheet amounts to average rates. This is not done on a line-by-line
basis, as details cannot be determined without unreasonable expense.