HSBC 2005 Annual Report Download - page 50
Download and view the complete annual report
Please find page 50 of the 2005 HSBC annual report below. You can navigate through the pages in the report by either clicking on the pages listed below, or by using the keyword search tool below to find specific information within the annual report.-
 1
1 -
2
-
3
-
4
-
5
-
6
-
7
-
8
-
9
-
10
-
11
-
12
-
13
-
14
-
15
-
16
-
17
-
18
-
19
-
20
-
21
-
22
-
23
-
24
-
25
-
26
-
27
-
28
-
29
-
30
-
31
-
32
-
33
-
34
-
35
-
36
-
37
-
38
-
39
-
 40
40 -
 41
41 -
 42
42 -
 43
43 -
 44
44 -
 45
45 -
 46
46 -
 47
47 -
 48
48 -
 49
49 -
 50
50 -
 51
51 -
 52
52 -
 53
53 -
 54
54 -
 55
55 -
 56
56 -
 57
57 -
 58
58 -
 59
59 -
 60
60 -
61
-
62
-
63
-
64
-
65
-
66
-
67
-
68
-
69
-
70
-
71
-
72
-
73
-
74
-
75
-
76
-
77
-
78
-
79
-
80
-
81
-
82
-
83
-
84
-
85
-
86
-
87
-
88
-
89
-
90
-
91
-
92
-
93
-
94
-
95
-
96
-
97
-
98
-
99
-
100
-
101
-
102
-
103
-
104
-
105
-
106
-
107
-
108
-
109
-
110
-
111
-
112
-
113
-
114
-
115
-
116
-
117
-
118
-
119
-
120
-
121
-
122
-
123
-
124
-
125
-
126
-
127
-
128
-
129
-
130
-
131
-
132
-
133
-
134
-
135
-
136
-
137
-
138
-
139
-
140
-
141
-
142
-
143
-
144
-
145
-
146
-
147
-
148
-
149
-
150
-
151
-
152
-
153
-
154
-
155
-
156
-
157
-
158
-
159
-
160
-
161
-
162
-
163
-
164
-
165
-
166
-
167
-
168
-
169
-
170
-
171
-
172
-
173
-
174
-
175
-
176
-
177
-
178
-
179
-
180
-
181
-
182
-
183
-
184
-
185
-
186
-
187
-
188
-
189
-
190
-
191
-
192
-
193
-
194
-
195
-
196
-
197
-
198
-
199
-
200
-
201
-
202
-
203
-
204
-
205
-
206
-
207
-
208
-
209
-
210
-
211
-
212
-
213
-
214
-
215
-
216
-
217
-
218
-
219
-
220
-
221
-
222
-
223
-
224
-
225
-
226
-
227
-
228
-
229
-
230
-
231
-
232
-
233
-
234
-
235
-
236
-
237
-
238
-
239
-
240
-
241
-
242
-
243
-
244
-
245
-
246
-
247
-
248
-
249
-
250
-
251
-
252
-
253
-
254
-
255
-
256
-
257
-
258
-
259
-
260
-
261
-
262
-
263
-
264
-
265
-
266
-
267
-
268
-
269
-
270
-
271
-
272
-
273
-
274
-
275
-
276
-
277
-
278
-
279
-
280
-
281
-
282
-
283
-
284
-
285
-
286
-
287
-
288
-
289
-
290
-
291
-
292
-
293
-
294
-
295
-
296
-
297
-
298
-
299
-
300
-
301
-
302
-
303
-
304
-
305
-
306
-
307
-
308
-
309
-
310
-
311
-
312
-
313
-
314
-
315
-
316
-
317
-
318
-
319
-
320
-
321
-
322
-
323
-
324
-
325
-
326
-
327
-
328
-
329
-
330
-
331
-
332
-
333
-
334
-
335
-
336
-
337
-
338
-
339
-
340
-
341
-
342
-
343
-
344
-
345
-
346
-
347
-
348
-
349
-
350
-
351
-
352
-
353
-
354
-
355
-
356
-
357
-
358
-
359
-
360
-
361
-
362
-
363
-
364
-
365
-
366
-
367
-
368
-
369
-
370
-
371
-
372
-
373
-
374
-
375
-
376
-
377
-
378
-
379
-
380
-
381
-
382
-
383
-
384
-
385
-
386
-
387
-
388
-
389
-
390
-
391
-
392
-
393
-
394
-
395
-
396
-
397
-
398
-
399
-
400
-
401
-
402
-
403
-
404
-
405
-
406
-
407
-
408
-
409
-
410
-
411
-
412
-
413
-
414
-
415
-
416
-
417
-
418
-
419
-
420
-
421
-
422
-
423
-
424
 |
 |

HSBC HOLDINGS PLC
Financial Review (continued)
48
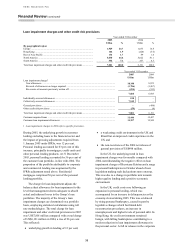
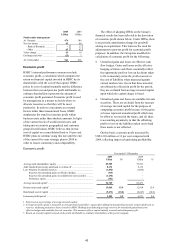
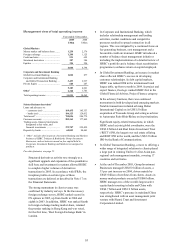
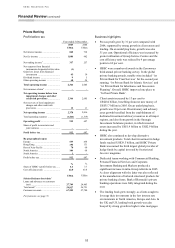
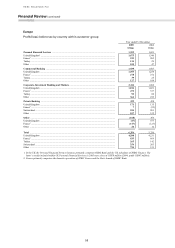
Commercial Banking
Profit before tax Business highlights
Year ended 31 December
2005 2004
US$m US$m
Net interest income ............................. 6,310 4,875
Net fee income ................................... 2,876 2,645
Trading income excluding net
interest income ............................... 150 234
Net interest expense
on trading activities ........................ (3) –
Net trading income1 ............................ 147 234
Net expense from financial
instruments designated at fair
value ............................................... (12) –
Net investment income on assets
backing policyholders’ liabilities .... – 324
Gains less losses from financial
investments .................................... 96
Dividend income ................................ 937
Net earned insurance premiums .......... 236 1,072
Other operating income ...................... 327 513
Total operating income .................... 9,902 9,706
Net insurance claims2 ......................... (118) (1,264)
Net operating income before loan
impairment charges and other
credit risk provisions .................... 9,784 8,442
Loan impairment charges and other
credit risk provisions ...................... (547) (200)
Net operating income ....................... 9,237 8,242
Total operating expenses .................... (4,453) (4,220)
Operating profit ................................ 4,784 4,022
Share of profit in associates and
joint ventures .................................. 177 35
Profit before tax ................................ 4,961 4,057
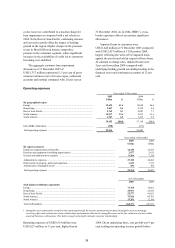
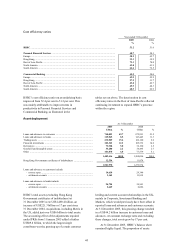
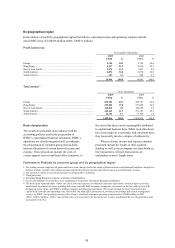
By geographical region
Europe ................................................ 1,939 1,663
Hong Kong ......................................... 955 904
Rest of Asia-Pacific ............................ 818 483
North America .................................... 1,064 848
South America .................................... 185 159
Profit before tax .................................. 4,961 4,057
%%
Share of HSBC’s profit before tax ...... 23.7 21.4
Cost efficiency ratio ........................... 45.5 50.0
US$m US$m
Selected balance sheet data3
Loans and advances to customers
(net) ................................................ 142,041 130,160
Total assets4 ........................................ 175,120 159,251
Customer accounts ............................. 148,106 137,801
For footnotes, see page 55.
• Pre-tax profit was 22 per cent higher than last year,
driven by strong growth in net operating income
before loan impairment, which more than
compensated for the non-recurrence of the loan
provision releases that benefited results in 2004. On
an underlying basis, profits increased by 19 per cent.
• Customer numbers rose by 10 per cent to 2.5 million
as customers were attracted by HSBC’s competitive
positioning. Loans and advances to customers and
customer account balances increased by 9 per cent
and 7 per cent respectively, with significant
expansion in the UK and Hong Kong. Interest spreads
increased in Hong Kong, North America and the Rest
of Asia-Pacific following interest rate rises.
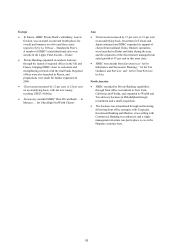
• The commercial customer base was refined and now
comprises four categories: Corporate, Mid-Market
(together, ‘MME’), Small and Micro businesses
(collectively, ‘SME’), building upon the successful
business segmentation model in existence in Hong
Kong and the UK.
• Cross-border sales were strengthened by the launch
of new cross-border referral programmes and the
global implementation of online cross-border account
opening and referral tools.
• HSBC’s competitiveness in meeting the needs of
SMEs was enhanced through the introduction of pre-
approved loans and lines of credit in Hong Kong, the
launch of scored lending in India, the introduction of
small business accounts in Singapore and the
expansion of business banking centres in Malaysia.
• Customers responded favourably to enhanced online
banking services, with numbers registered for internet
banking increasing by 24 per cent and online
transaction volumes during the year up by 116 per
cent.
• Business insurance and wealth management sales
continued to advance, supported by two new
dedicated insurance sales teams in Hong Kong. A
worksite marketing programme launched in Mexico,
and a programme across the Rest of Asia-Pacific to
increase the sale of structured investment products,
were also notable successes.
• Having enhanced its systems, HSBC retained its
position as ‘Best in Cash Management in Asia and
the Middle East’, its number two ranking in the world
and its top five ranking for Europe, North America,
Latin America and Africa in Euromoney’s 2005 Cash
Management Survey.