HSBC 2005 Annual Report Download - page 127
Download and view the complete annual report
Please find page 127 of the 2005 HSBC annual report below. You can navigate through the pages in the report by either clicking on the pages listed below, or by using the keyword search tool below to find specific information within the annual report.-
 1
1 -
2
-
3
-
4
-
5
-
6
-
7
-
8
-
9
-
10
-
11
-
12
-
13
-
14
-
15
-
16
-
17
-
18
-
19
-
20
-
21
-
22
-
23
-
24
-
25
-
26
-
27
-
28
-
29
-
30
-
31
-
32
-
33
-
34
-
35
-
36
-
37
-
38
-
39
-
40
-
41
-
42
-
43
-
44
-
45
-
46
-
47
-
48
-
49
-
50
-
51
-
52
-
53
-
54
-
55
-
56
-
57
-
58
-
59
-
60
-
61
-
62
-
63
-
64
-
65
-
66
-
67
-
68
-
69
-
70
-
71
-
72
-
73
-
74
-
75
-
76
-
77
-
78
-
79
-
80
-
81
-
82
-
83
-
84
-
85
-
86
-
87
-
88
-
89
-
90
-
91
-
92
-
93
-
94
-
95
-
96
-
97
-
98
-
99
-
100
-
101
-
102
-
103
-
104
-
105
-
106
-
107
-
108
-
109
-
110
-
111
-
112
-
113
-
114
-
115
-
116
-
 117
117 -
 118
118 -
 119
119 -
 120
120 -
 121
121 -
 122
122 -
 123
123 -
 124
124 -
 125
125 -
 126
126 -
 127
127 -
 128
128 -
 129
129 -
 130
130 -
 131
131 -
 132
132 -
 133
133 -
 134
134 -
 135
135 -
 136
136 -
 137
137 -
138
-
139
-
140
-
141
-
142
-
143
-
144
-
145
-
146
-
147
-
148
-
149
-
150
-
151
-
152
-
153
-
154
-
155
-
156
-
157
-
158
-
159
-
160
-
161
-
162
-
163
-
164
-
165
-
166
-
167
-
168
-
169
-
170
-
171
-
172
-
173
-
174
-
175
-
176
-
177
-
178
-
179
-
180
-
181
-
182
-
183
-
184
-
185
-
186
-
187
-
188
-
189
-
190
-
191
-
192
-
193
-
194
-
195
-
196
-
197
-
198
-
199
-
200
-
201
-
202
-
203
-
204
-
205
-
206
-
207
-
208
-
209
-
210
-
211
-
212
-
213
-
214
-
215
-
216
-
217
-
218
-
219
-
220
-
221
-
222
-
223
-
224
-
225
-
226
-
227
-
228
-
229
-
230
-
231
-
232
-
233
-
234
-
235
-
236
-
237
-
238
-
239
-
240
-
241
-
242
-
243
-
244
-
245
-
246
-
247
-
248
-
249
-
250
-
251
-
252
-
253
-
254
-
255
-
256
-
257
-
258
-
259
-
260
-
261
-
262
-
263
-
264
-
265
-
266
-
267
-
268
-
269
-
270
-
271
-
272
-
273
-
274
-
275
-
276
-
277
-
278
-
279
-
280
-
281
-
282
-
283
-
284
-
285
-
286
-
287
-
288
-
289
-
290
-
291
-
292
-
293
-
294
-
295
-
296
-
297
-
298
-
299
-
300
-
301
-
302
-
303
-
304
-
305
-
306
-
307
-
308
-
309
-
310
-
311
-
312
-
313
-
314
-
315
-
316
-
317
-
318
-
319
-
320
-
321
-
322
-
323
-
324
-
325
-
326
-
327
-
328
-
329
-
330
-
331
-
332
-
333
-
334
-
335
-
336
-
337
-
338
-
339
-
340
-
341
-
342
-
343
-
344
-
345
-
346
-
347
-
348
-
349
-
350
-
351
-
352
-
353
-
354
-
355
-
356
-
357
-
358
-
359
-
360
-
361
-
362
-
363
-
364
-
365
-
366
-
367
-
368
-
369
-
370
-
371
-
372
-
373
-
374
-
375
-
376
-
377
-
378
-
379
-
380
-
381
-
382
-
383
-
384
-
385
-
386
-
387
-
388
-
389
-
390
-
391
-
392
-
393
-
394
-
395
-
396
-
397
-
398
-
399
-
400
-
401
-
402
-
403
-
404
-
405
-
406
-
407
-
408
-
409
-
410
-
411
-
412
-
413
-
414
-
415
-
416
-
417
-
418
-
419
-
420
-
421
-
422
-
423
-
424
 |
 |

125
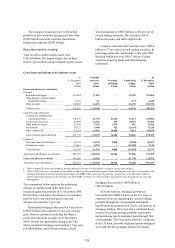
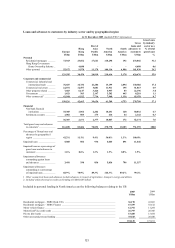
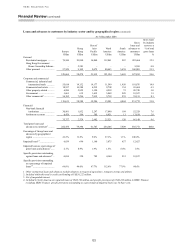
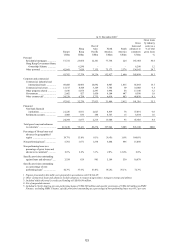
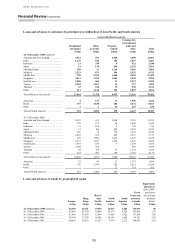
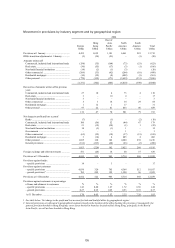
At 31 December 20011
Europe
Hong
Kong
Rest of
Asia-
Pacific
North
America
South
America
Gross
loans and
advances to
customers
Gross loans
by industry
sector as a
% of total
gross loans
US$m US$m US$m US$m US$m US$m %
Personal
Residential mortgages ............. 27,282 23,125 5,134 22,126 548 78,215 24.6
Hong Kong Government Home
Ownership Scheme ............. –8,123 –––8,123 2.6
Other personal ......................... 21,065 6,227 4,616 6,273 1,280 39,461 12.4
48,347 37,475 9,750 28,399 1,828 125,799 39.6
Corporate and commercial
Commercial, industrial and
international trade ............... 38,476 9,662 11,226 9,018 1,720 70,102 22.1
Commercial real estate ............ 9,475 8,474 2,395 5,877 77 26,298 8.3
Other property-related ............. 3,630 4,710 2,169 4,011 69 14,589 4.6
Government ............................. 2,393 543 900 728 775 5,339 1.7
Other commercial1 ................... 20,510 6,349 5,457 4,230 617 37,163 11.7
74,484 29,738 22,147 23,864 3,258 153,491 48.4
Financial
Non-bank financial
institutions ........................... 11,329 1,546 752 12,572 118 26,317 8.3
Settlement accounts ................. 2,361 223 189 8,984 4 11,761 3.7
13,690 1,769 941 21,556 122 38,078 12.0
Total gross loans and advances
to customers3 ........................... 136,521 68,982 32,838 73,819 5,208 317,368 100.0
Percentage of Group loans and
advances by geographical
region ....................................... 43.0% 21.7% 10.3% 23.3% 1.7% 100.0%
Non-performing loans4 ................. 3,682 2,028 2,723 672 544 9,649
Non-performing loans as a
percentage of gross loans and
advances to customers4 ............ 2.7% 2.9% 8.3% 0.9% 10.4% 3.0%
Specific provisions outstanding
against loans and advances ...... 2,204 856 1,786 289 365 5,500
Specific provisions outstanding
as a percentage of non-
performing loans4 .................... 59.8% 42.2% 65.6% 43.0% 67.1% 57.0%
1 Figures presented in this table were prepared in accordance with UK GAAP.
2 Other commercial loans include advances in respect of agriculture, transport, energy and utilities.
3 Included within this total is credit card lending of US$8,289 million.
4 Net of suspended interest.