HSBC 2005 Annual Report Download - page 143
Download and view the complete annual report
Please find page 143 of the 2005 HSBC annual report below. You can navigate through the pages in the report by either clicking on the pages listed below, or by using the keyword search tool below to find specific information within the annual report.-
 1
1 -
2
-
3
-
4
-
5
-
6
-
7
-
8
-
9
-
10
-
11
-
12
-
13
-
14
-
15
-
16
-
17
-
18
-
19
-
20
-
21
-
22
-
23
-
24
-
25
-
26
-
27
-
28
-
29
-
30
-
31
-
32
-
33
-
34
-
35
-
36
-
37
-
38
-
39
-
40
-
41
-
42
-
43
-
44
-
45
-
46
-
47
-
48
-
49
-
50
-
51
-
52
-
53
-
54
-
55
-
56
-
57
-
58
-
59
-
60
-
61
-
62
-
63
-
64
-
65
-
66
-
67
-
68
-
69
-
70
-
71
-
72
-
73
-
74
-
75
-
76
-
77
-
78
-
79
-
80
-
81
-
82
-
83
-
84
-
85
-
86
-
87
-
88
-
89
-
90
-
91
-
92
-
93
-
94
-
95
-
96
-
97
-
98
-
99
-
100
-
101
-
102
-
103
-
104
-
105
-
106
-
107
-
108
-
109
-
110
-
111
-
112
-
113
-
114
-
115
-
116
-
117
-
118
-
119
-
120
-
121
-
122
-
123
-
124
-
125
-
126
-
127
-
128
-
129
-
130
-
131
-
132
-
 133
133 -
 134
134 -
 135
135 -
 136
136 -
 137
137 -
 138
138 -
 139
139 -
 140
140 -
 141
141 -
 142
142 -
 143
143 -
 144
144 -
 145
145 -
 146
146 -
 147
147 -
 148
148 -
 149
149 -
 150
150 -
 151
151 -
 152
152 -
 153
153 -
154
-
155
-
156
-
157
-
158
-
159
-
160
-
161
-
162
-
163
-
164
-
165
-
166
-
167
-
168
-
169
-
170
-
171
-
172
-
173
-
174
-
175
-
176
-
177
-
178
-
179
-
180
-
181
-
182
-
183
-
184
-
185
-
186
-
187
-
188
-
189
-
190
-
191
-
192
-
193
-
194
-
195
-
196
-
197
-
198
-
199
-
200
-
201
-
202
-
203
-
204
-
205
-
206
-
207
-
208
-
209
-
210
-
211
-
212
-
213
-
214
-
215
-
216
-
217
-
218
-
219
-
220
-
221
-
222
-
223
-
224
-
225
-
226
-
227
-
228
-
229
-
230
-
231
-
232
-
233
-
234
-
235
-
236
-
237
-
238
-
239
-
240
-
241
-
242
-
243
-
244
-
245
-
246
-
247
-
248
-
249
-
250
-
251
-
252
-
253
-
254
-
255
-
256
-
257
-
258
-
259
-
260
-
261
-
262
-
263
-
264
-
265
-
266
-
267
-
268
-
269
-
270
-
271
-
272
-
273
-
274
-
275
-
276
-
277
-
278
-
279
-
280
-
281
-
282
-
283
-
284
-
285
-
286
-
287
-
288
-
289
-
290
-
291
-
292
-
293
-
294
-
295
-
296
-
297
-
298
-
299
-
300
-
301
-
302
-
303
-
304
-
305
-
306
-
307
-
308
-
309
-
310
-
311
-
312
-
313
-
314
-
315
-
316
-
317
-
318
-
319
-
320
-
321
-
322
-
323
-
324
-
325
-
326
-
327
-
328
-
329
-
330
-
331
-
332
-
333
-
334
-
335
-
336
-
337
-
338
-
339
-
340
-
341
-
342
-
343
-
344
-
345
-
346
-
347
-
348
-
349
-
350
-
351
-
352
-
353
-
354
-
355
-
356
-
357
-
358
-
359
-
360
-
361
-
362
-
363
-
364
-
365
-
366
-
367
-
368
-
369
-
370
-
371
-
372
-
373
-
374
-
375
-
376
-
377
-
378
-
379
-
380
-
381
-
382
-
383
-
384
-
385
-
386
-
387
-
388
-
389
-
390
-
391
-
392
-
393
-
394
-
395
-
396
-
397
-
398
-
399
-
400
-
401
-
402
-
403
-
404
-
405
-
406
-
407
-
408
-
409
-
410
-
411
-
412
-
413
-
414
-
415
-
416
-
417
-
418
-
419
-
420
-
421
-
422
-
423
-
424
 |
 |

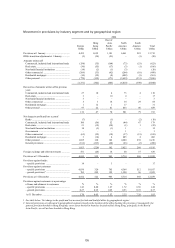
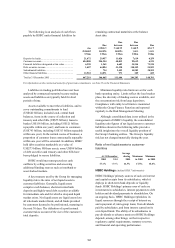
141
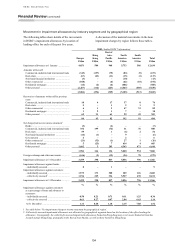
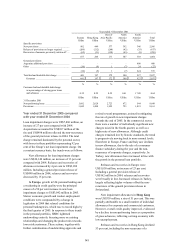
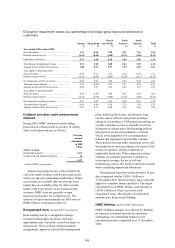
Year ended 31 December 2001
Europe
US$m
Hong Kong
US$m
Rest of
Asia-Pacific
US$m
North
America
US$m
South
America
US$m
Total
US$m
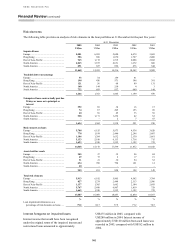
Specific provisions
New provisions ................................................... 802 449 577 392 346 2,566
Release of provisions no longer required ............ (260) (212) (268) (42) (35) (817)
Recoveries of amounts previously written off .... (65) (31) (138) (43) (8) (285)
477 206 171 307 303 1,464
General provisions
Argentine additional provision ........................... ––––600 600
Other .................................................................. (36) (9) 1 (7) 24 (27)
(36) (9) 1 (7) 624 573
Total bad and doubtful debt charge .................... 441 197 172 300 927 2,037
Customer ........................................................ 441 197 172 300 927 2,037
%%%%%%
Customer bad and doubtful debt charge
as a percentage of closing gross loans
and advances ................................................. 0.32 0.29 0.52 0.41 17.80 0.64
US$m US$m US$m US$m US$m US$m
31 December 2001
Non-performing loans ........................................ 3,682 2,028 2,723 672 544 9,649
Provisions ........................................................... 3,045 1,408 1,952 723 1,033 8,161
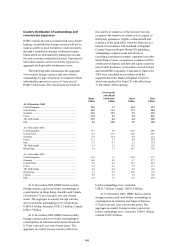
Year ended 31 December 2005 compared
with year ended 31 December 2004
Loan impairment charges were US$7,860 million, an
increase of 27 per cent compared with 2004.
Acquisitions accounted for US$107 million of the
rise and US$498 million reflected the non-recurrence
of the general provision release in 2004. The total
charge remained dominated by the personal sector,
with losses in these portfolios representing 92 per
cent of the Group’s net loan impairment charge. On
a constant currency basis, the trends were as follows:
New allowances for loan impairment charges
were US$10,140 million, an increase of 13 per cent
compared with 2004. Releases and recoveries of
allowances increased by 4 per cent to US$2,280
million. Including a general provision release of
US$498 million in 2004, releases and recoveries
decreased by 15 per cent.
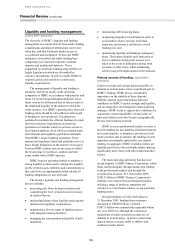
In Europe, growth in UK personal lending and
a weakening in credit quality were the principal
causes of a 50 per cent increase in new loan
impairment charges to US$3,042 million in 2005.
Slower economic growth and weaker employment
conditions were compounded by a change in
legislation in 2004 that relaxed conditions for
personal bankruptcies, which rose to record highs by
the final quarter of 2005. In response to these trends
in the personal portfolio, HSBC tightened
underwriting controls, focusing more on existing
relationships and changing the product mix towards
lower risk customers. These actions, together with
further centralisation of underwriting approvals and
revised reward programmes, assisted in mitigating
the rate of growth in new impairment charges
towards the end of 2005. In the commercial sector,
there were a number of individually significant new
charges raised in the fourth quarter, as well as a
higher rate of new allowances. Although credit
charges remained low by historic standards, the trend
is progressively moving back to more normal levels.
Elsewhere in Europe, France and Italy saw declines
in new allowances, due to the sale of a consumer
finance subsidiary during the year and the non-
recurrence of corporate charges, respectively. In
Turkey, new allowances have increased in line with
the growth in the personal loan portfolio.
Releases and recoveries in Europe were
US$1,058 million, an increase of 23 per cent.
Including a general provision release of
US$162 million in 2004, releases and recoveries
were broadly in line. Increased releases in Turkey,
largely reflecting higher volumes offset the non-
recurrence of the general provision release in
Switzerland.
New impairment allowances in Hong Kong
were US$359 million, a rise of 51 per cent. This was
partially attributable to a small number of individual
allowances for corporate and commercial customers.
However, overall credit quality improved, evidenced
by a decline in non-performing loans as a proportion
of gross advances, reflecting a strong economy with
low unemployment.
Releases and recoveries in Hong Kong declined
53 per cent, including the non-recurrence of a