HSBC 2005 Annual Report Download - page 269
Download and view the complete annual report
Please find page 269 of the 2005 HSBC annual report below. You can navigate through the pages in the report by either clicking on the pages listed below, or by using the keyword search tool below to find specific information within the annual report.-
 1
1 -
2
-
3
-
4
-
5
-
6
-
7
-
8
-
9
-
10
-
11
-
12
-
13
-
14
-
15
-
16
-
17
-
18
-
19
-
20
-
21
-
22
-
23
-
24
-
25
-
26
-
27
-
28
-
29
-
30
-
31
-
32
-
33
-
34
-
35
-
36
-
37
-
38
-
39
-
40
-
41
-
42
-
43
-
44
-
45
-
46
-
47
-
48
-
49
-
50
-
51
-
52
-
53
-
54
-
55
-
56
-
57
-
58
-
59
-
60
-
61
-
62
-
63
-
64
-
65
-
66
-
67
-
68
-
69
-
70
-
71
-
72
-
73
-
74
-
75
-
76
-
77
-
78
-
79
-
80
-
81
-
82
-
83
-
84
-
85
-
86
-
87
-
88
-
89
-
90
-
91
-
92
-
93
-
94
-
95
-
96
-
97
-
98
-
99
-
100
-
101
-
102
-
103
-
104
-
105
-
106
-
107
-
108
-
109
-
110
-
111
-
112
-
113
-
114
-
115
-
116
-
117
-
118
-
119
-
120
-
121
-
122
-
123
-
124
-
125
-
126
-
127
-
128
-
129
-
130
-
131
-
132
-
133
-
134
-
135
-
136
-
137
-
138
-
139
-
140
-
141
-
142
-
143
-
144
-
145
-
146
-
147
-
148
-
149
-
150
-
151
-
152
-
153
-
154
-
155
-
156
-
157
-
158
-
159
-
160
-
161
-
162
-
163
-
164
-
165
-
166
-
167
-
168
-
169
-
170
-
171
-
172
-
173
-
174
-
175
-
176
-
177
-
178
-
179
-
180
-
181
-
182
-
183
-
184
-
185
-
186
-
187
-
188
-
189
-
190
-
191
-
192
-
193
-
194
-
195
-
196
-
197
-
198
-
199
-
200
-
201
-
202
-
203
-
204
-
205
-
206
-
207
-
208
-
209
-
210
-
211
-
212
-
213
-
214
-
215
-
216
-
217
-
218
-
219
-
220
-
221
-
222
-
223
-
224
-
225
-
226
-
227
-
228
-
229
-
230
-
231
-
232
-
233
-
234
-
235
-
236
-
237
-
238
-
239
-
240
-
241
-
242
-
243
-
244
-
245
-
246
-
247
-
248
-
249
-
250
-
251
-
252
-
253
-
254
-
255
-
256
-
257
-
258
-
 259
259 -
 260
260 -
 261
261 -
 262
262 -
 263
263 -
 264
264 -
 265
265 -
 266
266 -
 267
267 -
 268
268 -
 269
269 -
 270
270 -
 271
271 -
 272
272 -
 273
273 -
 274
274 -
 275
275 -
 276
276 -
 277
277 -
 278
278 -
 279
279 -
280
-
281
-
282
-
283
-
284
-
285
-
286
-
287
-
288
-
289
-
290
-
291
-
292
-
293
-
294
-
295
-
296
-
297
-
298
-
299
-
300
-
301
-
302
-
303
-
304
-
305
-
306
-
307
-
308
-
309
-
310
-
311
-
312
-
313
-
314
-
315
-
316
-
317
-
318
-
319
-
320
-
321
-
322
-
323
-
324
-
325
-
326
-
327
-
328
-
329
-
330
-
331
-
332
-
333
-
334
-
335
-
336
-
337
-
338
-
339
-
340
-
341
-
342
-
343
-
344
-
345
-
346
-
347
-
348
-
349
-
350
-
351
-
352
-
353
-
354
-
355
-
356
-
357
-
358
-
359
-
360
-
361
-
362
-
363
-
364
-
365
-
366
-
367
-
368
-
369
-
370
-
371
-
372
-
373
-
374
-
375
-
376
-
377
-
378
-
379
-
380
-
381
-
382
-
383
-
384
-
385
-
386
-
387
-
388
-
389
-
390
-
391
-
392
-
393
-
394
-
395
-
396
-
397
-
398
-
399
-
400
-
401
-
402
-
403
-
404
-
405
-
406
-
407
-
408
-
409
-
410
-
411
-
412
-
413
-
414
-
415
-
416
-
417
-
418
-
419
-
420
-
421
-
422
-
423
-
424
 |
 |

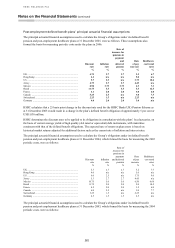
267
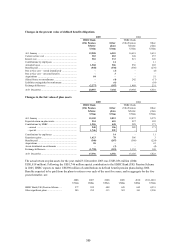
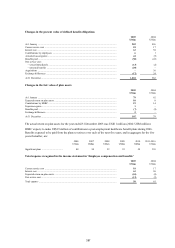
Changes in the present value of defined benefit obligations
2005 2004
US$m US$m
At 1 January ................................................................................................................................... 982 886
Current service cost ....................................................................................................................... 18 17
Interest cost .................................................................................................................................... 63 58
Contributions by employees .......................................................................................................... 61
Actuarial losses/(gains) .................................................................................................................. 44 (5)
Benefits paid .................................................................................................................................. (50) (43)
Past service cost:
– vested immediately ................................................................................................................. (13) (2)
– unvested benefits .................................................................................................................... (29) –
Acquisitions ................................................................................................................................... –36
Exchange differences ..................................................................................................................... (17) 34
At 31 December ............................................................................................................................. 1,004 982
Changes in the fair value of plan assets
2005 2004
US$m US$m
At 1 January ................................................................................................................................... 79 62
Expected return on plan assets ....................................................................................................... 10 8
Contributions by HSBC ................................................................................................................. 19 14
Experience gains ............................................................................................................................ 1–
Benefits paid .................................................................................................................................. (7) (5)
Exchange differences ..................................................................................................................... 5–
At 31 December ............................................................................................................................. 107 79
The actual return on plan assets for the year ended 31 December 2005 was US$11 million (2004: US$8 million).
HSBC expects to make US$19 million of contributions to post-employment healthcare benefit plans during 2006.
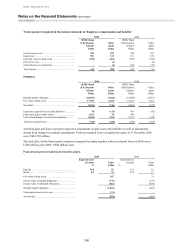
Benefits expected to be paid from the plans to retirees over each of the next five years, and in aggregate for the five
years thereafter, are:
2006 2007 2008 2009 2010 2011-2016
US$m US$m US$m US$m US$m US$m
Significant plans ................................... 48 50 52 55 58 359
Total expense recognised in the income statement in ‘Employee compensation and benefits’
2005 2004
US$m US$m
Current service cost ....................................................................................................................... 18 17
Interest cost .................................................................................................................................... 63 58
Expected return on plan assets ....................................................................................................... (10) (8)
Past service cost ............................................................................................................................. (13) (2)
Total expense ................................................................................................................................. 58 65