HSBC 2005 Annual Report Download - page 31
Download and view the complete annual report
Please find page 31 of the 2005 HSBC annual report below. You can navigate through the pages in the report by either clicking on the pages listed below, or by using the keyword search tool below to find specific information within the annual report.-
 1
1 -
2
-
3
-
4
-
5
-
6
-
7
-
8
-
9
-
10
-
11
-
12
-
13
-
14
-
15
-
16
-
17
-
18
-
19
-
20
-
 21
21 -
 22
22 -
 23
23 -
 24
24 -
 25
25 -
 26
26 -
 27
27 -
 28
28 -
 29
29 -
 30
30 -
 31
31 -
 32
32 -
 33
33 -
 34
34 -
 35
35 -
 36
36 -
 37
37 -
 38
38 -
 39
39 -
 40
40 -
 41
41 -
42
-
43
-
44
-
45
-
46
-
47
-
48
-
49
-
50
-
51
-
52
-
53
-
54
-
55
-
56
-
57
-
58
-
59
-
60
-
61
-
62
-
63
-
64
-
65
-
66
-
67
-
68
-
69
-
70
-
71
-
72
-
73
-
74
-
75
-
76
-
77
-
78
-
79
-
80
-
81
-
82
-
83
-
84
-
85
-
86
-
87
-
88
-
89
-
90
-
91
-
92
-
93
-
94
-
95
-
96
-
97
-
98
-
99
-
100
-
101
-
102
-
103
-
104
-
105
-
106
-
107
-
108
-
109
-
110
-
111
-
112
-
113
-
114
-
115
-
116
-
117
-
118
-
119
-
120
-
121
-
122
-
123
-
124
-
125
-
126
-
127
-
128
-
129
-
130
-
131
-
132
-
133
-
134
-
135
-
136
-
137
-
138
-
139
-
140
-
141
-
142
-
143
-
144
-
145
-
146
-
147
-
148
-
149
-
150
-
151
-
152
-
153
-
154
-
155
-
156
-
157
-
158
-
159
-
160
-
161
-
162
-
163
-
164
-
165
-
166
-
167
-
168
-
169
-
170
-
171
-
172
-
173
-
174
-
175
-
176
-
177
-
178
-
179
-
180
-
181
-
182
-
183
-
184
-
185
-
186
-
187
-
188
-
189
-
190
-
191
-
192
-
193
-
194
-
195
-
196
-
197
-
198
-
199
-
200
-
201
-
202
-
203
-
204
-
205
-
206
-
207
-
208
-
209
-
210
-
211
-
212
-
213
-
214
-
215
-
216
-
217
-
218
-
219
-
220
-
221
-
222
-
223
-
224
-
225
-
226
-
227
-
228
-
229
-
230
-
231
-
232
-
233
-
234
-
235
-
236
-
237
-
238
-
239
-
240
-
241
-
242
-
243
-
244
-
245
-
246
-
247
-
248
-
249
-
250
-
251
-
252
-
253
-
254
-
255
-
256
-
257
-
258
-
259
-
260
-
261
-
262
-
263
-
264
-
265
-
266
-
267
-
268
-
269
-
270
-
271
-
272
-
273
-
274
-
275
-
276
-
277
-
278
-
279
-
280
-
281
-
282
-
283
-
284
-
285
-
286
-
287
-
288
-
289
-
290
-
291
-
292
-
293
-
294
-
295
-
296
-
297
-
298
-
299
-
300
-
301
-
302
-
303
-
304
-
305
-
306
-
307
-
308
-
309
-
310
-
311
-
312
-
313
-
314
-
315
-
316
-
317
-
318
-
319
-
320
-
321
-
322
-
323
-
324
-
325
-
326
-
327
-
328
-
329
-
330
-
331
-
332
-
333
-
334
-
335
-
336
-
337
-
338
-
339
-
340
-
341
-
342
-
343
-
344
-
345
-
346
-
347
-
348
-
349
-
350
-
351
-
352
-
353
-
354
-
355
-
356
-
357
-
358
-
359
-
360
-
361
-
362
-
363
-
364
-
365
-
366
-
367
-
368
-
369
-
370
-
371
-
372
-
373
-
374
-
375
-
376
-
377
-
378
-
379
-
380
-
381
-
382
-
383
-
384
-
385
-
386
-
387
-
388
-
389
-
390
-
391
-
392
-
393
-
394
-
395
-
396
-
397
-
398
-
399
-
400
-
401
-
402
-
403
-
404
-
405
-
406
-
407
-
408
-
409
-
410
-
411
-
412
-
413
-
414
-
415
-
416
-
417
-
418
-
419
-
420
-
421
-
422
-
423
-
424
 |
 |
29
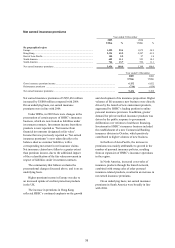
network and the launch of new savings products,
including an online savings product which attracted
a significant number of new customers. Treasury
income from balance sheet management within
Corporate, Investment Banking and Markets
diminished as the rise in short-term interest rates
limited opportunities to profit from placing the
liquidity generated from core banking operations
over extended periods.
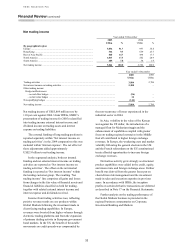
In Hong Kong, net interest income rose by
17 per cent. Rising interest rates reinvigorated
demand for traditional savings products, driving
increases in personal and commercial savings
balances. Coupled with the rise in deposit spreads,
which increased in line with interest rates, this led to
a sharp rise in net interest income. Mortgage spreads,
however, contracted, as the gradual increase in
yields during the year, in line with higher rates, was
more than offset by rising funding costs. There was
little net new lending for residential mortgages as
interest rate rises cooled the residential property
market in the second half of 2005. Economic growth
in mainland China boosted commercial lending to
the trade and manufacturing sectors, and property
lending also increased. Treasury income remained
under pressure, with rising short-term interest rates
and a flat yield curve providing limited opportunities
to profitably deploy surplus liquidity and increasing
funding costs.
In the Rest of Asia-Pacific, net interest income
increased by 24 per cent, reflecting business
expansion and favourable economic conditions
throughout the region. In the Middle East, buoyant
oil-based economies stimulated demand for credit
for property and infrastructure projects. Increasing
personal and corporate wealth contributed to growth
in deposit balances, while interest rate rises led to
higher deposit spreads. General economic expansion
created demand for consumption credit which
boosted credit card lending. For the reasons noted
above, treasury income from balance sheet
management was weaker.
In South America, the positive economic
environment encouraged growth in personal and
commercial lending, particularly in credit cards and
vehicle finance, which led to a 35 per cent increase
in net interest income. A significant rise in customer
acquisition and the development of the Losango
customer base in Brazil also contributed.
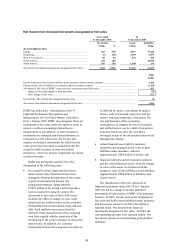
Average interest-earning assets increased by
US$23 billion, or 2 per cent, compared with 2004.
At constant exchange rates, and excluding the
US$84.7 billion of trading assets in 2004, average
interest-earning assets increased by 11 per cent,
reflecting strong growth in mortgages, personal
lending and cards globally, and increased lending in
Commercial Banking.
HSBC’s net interest margin was 3.14 per cent in
2005 compared with 3.19 in 2004. For the reasons
set out in the opening paragraphs, these figures are
not strictly comparable as a result of presentation
changes under IFRSs from 1 January 2005.