HSBC 2005 Annual Report Download - page 171
Download and view the complete annual report
Please find page 171 of the 2005 HSBC annual report below. You can navigate through the pages in the report by either clicking on the pages listed below, or by using the keyword search tool below to find specific information within the annual report.-
 1
1 -
2
-
3
-
4
-
5
-
6
-
7
-
8
-
9
-
10
-
11
-
12
-
13
-
14
-
15
-
16
-
17
-
18
-
19
-
20
-
21
-
22
-
23
-
24
-
25
-
26
-
27
-
28
-
29
-
30
-
31
-
32
-
33
-
34
-
35
-
36
-
37
-
38
-
39
-
40
-
41
-
42
-
43
-
44
-
45
-
46
-
47
-
48
-
49
-
50
-
51
-
52
-
53
-
54
-
55
-
56
-
57
-
58
-
59
-
60
-
61
-
62
-
63
-
64
-
65
-
66
-
67
-
68
-
69
-
70
-
71
-
72
-
73
-
74
-
75
-
76
-
77
-
78
-
79
-
80
-
81
-
82
-
83
-
84
-
85
-
86
-
87
-
88
-
89
-
90
-
91
-
92
-
93
-
94
-
95
-
96
-
97
-
98
-
99
-
100
-
101
-
102
-
103
-
104
-
105
-
106
-
107
-
108
-
109
-
110
-
111
-
112
-
113
-
114
-
115
-
116
-
117
-
118
-
119
-
120
-
121
-
122
-
123
-
124
-
125
-
126
-
127
-
128
-
129
-
130
-
131
-
132
-
133
-
134
-
135
-
136
-
137
-
138
-
139
-
140
-
141
-
142
-
143
-
144
-
145
-
146
-
147
-
148
-
149
-
150
-
151
-
152
-
153
-
154
-
155
-
156
-
157
-
158
-
159
-
160
-
 161
161 -
 162
162 -
 163
163 -
 164
164 -
 165
165 -
 166
166 -
 167
167 -
 168
168 -
 169
169 -
 170
170 -
 171
171 -
 172
172 -
 173
173 -
 174
174 -
 175
175 -
 176
176 -
 177
177 -
 178
178 -
 179
179 -
 180
180 -
 181
181 -
182
-
183
-
184
-
185
-
186
-
187
-
188
-
189
-
190
-
191
-
192
-
193
-
194
-
195
-
196
-
197
-
198
-
199
-
200
-
201
-
202
-
203
-
204
-
205
-
206
-
207
-
208
-
209
-
210
-
211
-
212
-
213
-
214
-
215
-
216
-
217
-
218
-
219
-
220
-
221
-
222
-
223
-
224
-
225
-
226
-
227
-
228
-
229
-
230
-
231
-
232
-
233
-
234
-
235
-
236
-
237
-
238
-
239
-
240
-
241
-
242
-
243
-
244
-
245
-
246
-
247
-
248
-
249
-
250
-
251
-
252
-
253
-
254
-
255
-
256
-
257
-
258
-
259
-
260
-
261
-
262
-
263
-
264
-
265
-
266
-
267
-
268
-
269
-
270
-
271
-
272
-
273
-
274
-
275
-
276
-
277
-
278
-
279
-
280
-
281
-
282
-
283
-
284
-
285
-
286
-
287
-
288
-
289
-
290
-
291
-
292
-
293
-
294
-
295
-
296
-
297
-
298
-
299
-
300
-
301
-
302
-
303
-
304
-
305
-
306
-
307
-
308
-
309
-
310
-
311
-
312
-
313
-
314
-
315
-
316
-
317
-
318
-
319
-
320
-
321
-
322
-
323
-
324
-
325
-
326
-
327
-
328
-
329
-
330
-
331
-
332
-
333
-
334
-
335
-
336
-
337
-
338
-
339
-
340
-
341
-
342
-
343
-
344
-
345
-
346
-
347
-
348
-
349
-
350
-
351
-
352
-
353
-
354
-
355
-
356
-
357
-
358
-
359
-
360
-
361
-
362
-
363
-
364
-
365
-
366
-
367
-
368
-
369
-
370
-
371
-
372
-
373
-
374
-
375
-
376
-
377
-
378
-
379
-
380
-
381
-
382
-
383
-
384
-
385
-
386
-
387
-
388
-
389
-
390
-
391
-
392
-
393
-
394
-
395
-
396
-
397
-
398
-
399
-
400
-
401
-
402
-
403
-
404
-
405
-
406
-
407
-
408
-
409
-
410
-
411
-
412
-
413
-
414
-
415
-
416
-
417
-
418
-
419
-
420
-
421
-
422
-
423
-
424
 |
 |
169
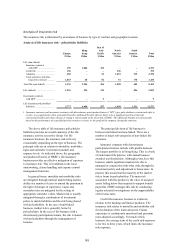
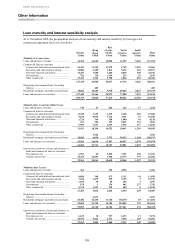
The interest rate sensitivities set out above are
illustrative only and employ simplified scenarios.
They are based on US$8,068 million of interest-
bearing securities held by insurance underwriting
subsidiaries at 31 December 2005 and
US$3,350 million of insurance liabilities under
insurance contracts and long-term investment
contracts issued. The sensitivities do not incorporate
actions that could be taken by management to
mitigate the effect of the interest rate movements,
nor do they take account of consequential changes in
policyholder behaviour.
The majority of interest rate exposure arises
within insurance underwriting subsidiaries in the
UK, the US and Hong Kong.
HSBC’s insurance underwriting subsidiaries are
also exposed to the risk that the yield on assets held
may fall short of the return guaranteed on certain
contracts issued to policyholders. This investment
return guarantee risk is managed by matching assets
held to liability requirements. In addition, a
provision is established when analysis indicates that,
over the life of the contracts, the returns from the
designated assets may not be adequate to cover the
related liabilities.
The guarantees offered to policyholders in
respect of certain insurance products are divided into
broad categories as follows:
• annuities in payment;
• deferred annuities: these consist of two phases –
the savings and investing phase, and the
retirement income phase;
• annual return: the investment return credited to
the policyholder every year (referred to as a
‘hard’ guarantee), or the average annual
investment return credited to the policyholder
over the life of the policy to its maturity or
surrender (referred to as a ‘soft’ guarantee) is
guaranteed to be no lower than a specified rate;
• capital: policyholders are guaranteed to receive
back no less than the premiums paid less
expenses, or a cash payment or series of cash
payments whose amounts are at least equal to
those defined within the policy; and
• market performance: policyholders receive an
investment return which is guaranteed to be
within a prescribed range of average investment
returns earned by predetermined market
participants on the specified product.
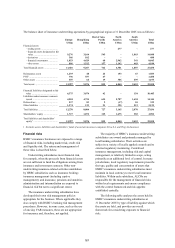
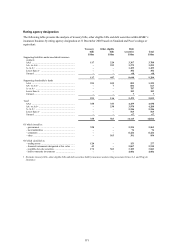
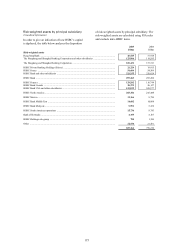
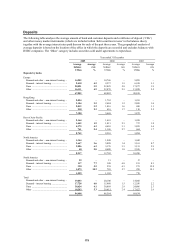
The table below shows, in respect of each
category of guarantee, the total reserves established
for guaranteed products, the range of investment
returns implied by the guarantees, and the range of
current yields of the investment portfolios supporting
the guarantees.
Reserve
Investment
returns implied
by guarantee1Current yields
US$m % %
Annuities in payment .................................................................................... 1,063 0.0 – 4.2% 4.0 – 13.0%
Deferred annuities ........................................................................................ 408 0.0 – 6.0% 6.1 – 8.6%
Deferred annuities ........................................................................................ 674 6.0 – 9.0% 5.7%
Annual return ............................................................................................... 4,362 0.0 – 3.0% 3.5 – 5.6%
Annual return ............................................................................................... 581 3.0 – 6.0% 3.5 – 11.5%
Capital .......................................................................................................... 1,168 0.0% 2.9 – 5.6%
Market performance2 .................................................................................... 2,938 n/a n/a
1The above table excludes guarantees from associate insurance companies Erisa, S.A. and Ping An Insurance.
2There is no specific investment return implied by market performance guarantees because the guarantees are expressed as lying within
prescribed ranges of average market returns.
The Group manages the annuities, annual return
and capital guarantees by seeking to match the
exposure predominantly with bonds which are
producing a return at least equal to the investment
return implied by the guarantee. Provision is made
for any anticipated shortfall, generally calculated by
recourse to stress testing of the likely outcomes.
The main risk arising from these guarantees is
reinvestment risk, which arises primarily when the
duration of the policy extends beyond the maturity
dates of the bonds. Future reinvestment yields may
be less than the investment rates implied by the
guarantee.
A certain number of these products have been
discontinued to new business; this includes the
deferred annuity portfolio in HSBC Finance, where
the current portfolio yield is less than the guarantee
and highlighted in the above table. For this block of
business, a purchase accounting reserve was made at
the time of the acquisition of HSBC Finance to
mitigate the impact of the disparity in yields. In