HSBC 2005 Annual Report Download - page 161
Download and view the complete annual report
Please find page 161 of the 2005 HSBC annual report below. You can navigate through the pages in the report by either clicking on the pages listed below, or by using the keyword search tool below to find specific information within the annual report.-
 1
1 -
2
-
3
-
4
-
5
-
6
-
7
-
8
-
9
-
10
-
11
-
12
-
13
-
14
-
15
-
16
-
17
-
18
-
19
-
20
-
21
-
22
-
23
-
24
-
25
-
26
-
27
-
28
-
29
-
30
-
31
-
32
-
33
-
34
-
35
-
36
-
37
-
38
-
39
-
40
-
41
-
42
-
43
-
44
-
45
-
46
-
47
-
48
-
49
-
50
-
51
-
52
-
53
-
54
-
55
-
56
-
57
-
58
-
59
-
60
-
61
-
62
-
63
-
64
-
65
-
66
-
67
-
68
-
69
-
70
-
71
-
72
-
73
-
74
-
75
-
76
-
77
-
78
-
79
-
80
-
81
-
82
-
83
-
84
-
85
-
86
-
87
-
88
-
89
-
90
-
91
-
92
-
93
-
94
-
95
-
96
-
97
-
98
-
99
-
100
-
101
-
102
-
103
-
104
-
105
-
106
-
107
-
108
-
109
-
110
-
111
-
112
-
113
-
114
-
115
-
116
-
117
-
118
-
119
-
120
-
121
-
122
-
123
-
124
-
125
-
126
-
127
-
128
-
129
-
130
-
131
-
132
-
133
-
134
-
135
-
136
-
137
-
138
-
139
-
140
-
141
-
142
-
143
-
144
-
145
-
146
-
147
-
148
-
149
-
150
-
 151
151 -
 152
152 -
 153
153 -
 154
154 -
 155
155 -
 156
156 -
 157
157 -
 158
158 -
 159
159 -
 160
160 -
 161
161 -
 162
162 -
 163
163 -
 164
164 -
 165
165 -
 166
166 -
 167
167 -
 168
168 -
 169
169 -
 170
170 -
 171
171 -
172
-
173
-
174
-
175
-
176
-
177
-
178
-
179
-
180
-
181
-
182
-
183
-
184
-
185
-
186
-
187
-
188
-
189
-
190
-
191
-
192
-
193
-
194
-
195
-
196
-
197
-
198
-
199
-
200
-
201
-
202
-
203
-
204
-
205
-
206
-
207
-
208
-
209
-
210
-
211
-
212
-
213
-
214
-
215
-
216
-
217
-
218
-
219
-
220
-
221
-
222
-
223
-
224
-
225
-
226
-
227
-
228
-
229
-
230
-
231
-
232
-
233
-
234
-
235
-
236
-
237
-
238
-
239
-
240
-
241
-
242
-
243
-
244
-
245
-
246
-
247
-
248
-
249
-
250
-
251
-
252
-
253
-
254
-
255
-
256
-
257
-
258
-
259
-
260
-
261
-
262
-
263
-
264
-
265
-
266
-
267
-
268
-
269
-
270
-
271
-
272
-
273
-
274
-
275
-
276
-
277
-
278
-
279
-
280
-
281
-
282
-
283
-
284
-
285
-
286
-
287
-
288
-
289
-
290
-
291
-
292
-
293
-
294
-
295
-
296
-
297
-
298
-
299
-
300
-
301
-
302
-
303
-
304
-
305
-
306
-
307
-
308
-
309
-
310
-
311
-
312
-
313
-
314
-
315
-
316
-
317
-
318
-
319
-
320
-
321
-
322
-
323
-
324
-
325
-
326
-
327
-
328
-
329
-
330
-
331
-
332
-
333
-
334
-
335
-
336
-
337
-
338
-
339
-
340
-
341
-
342
-
343
-
344
-
345
-
346
-
347
-
348
-
349
-
350
-
351
-
352
-
353
-
354
-
355
-
356
-
357
-
358
-
359
-
360
-
361
-
362
-
363
-
364
-
365
-
366
-
367
-
368
-
369
-
370
-
371
-
372
-
373
-
374
-
375
-
376
-
377
-
378
-
379
-
380
-
381
-
382
-
383
-
384
-
385
-
386
-
387
-
388
-
389
-
390
-
391
-
392
-
393
-
394
-
395
-
396
-
397
-
398
-
399
-
400
-
401
-
402
-
403
-
404
-
405
-
406
-
407
-
408
-
409
-
410
-
411
-
412
-
413
-
414
-
415
-
416
-
417
-
418
-
419
-
420
-
421
-
422
-
423
-
424
 |
 |
159
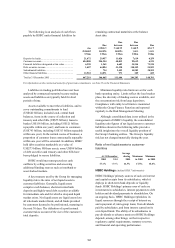
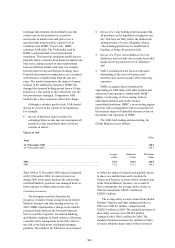
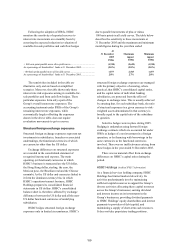
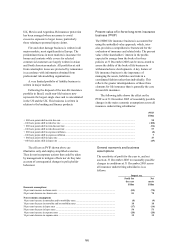
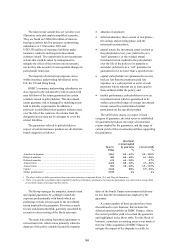
Following the adoption of IFRSs, HSBC
monitors the sensitivity of reported reserves to
interest rate movements on a monthly basis by
assessing the expected reduction in valuation of
available-for-sale portfolios and cash flow hedges
due to parallel movements of plus or minus
100 basis points in all yield curves. The table below
describes the sensitivity to these movements at
31 December 2005 and the maximum and minimum
month figures during the year then ended:
At
31 December
2005
US$m
Maximum
impact
US$m
Minimum
impact
US$m
+ 100 basis point parallel move all in yield curves ........................................ (1,918) (2,655) (1,918)
As a percentage of shareholders’ funds at 31 December 2005....................... (2.0%) (2.8%) (2.0%)
- 100 basis point parallel move all in yield curves ......................................... 1,877 2,543 1,877
As a percentage of shareholders’ funds at 31 December 2005....................... 2.0% 2.7% 2.0%
The sensitivities included in the table are
illustrative only and are based on simplified
scenarios. Moreover, the table shows only those
interest rate risk exposures arising in available-for-
sale portfolios and from cash flow hedges. These
particular exposures form only a part of the
Group’s overall interest rate exposures. The
accounting treatment under IFRSs of the Group’s
remaining interest rate exposures, while
economically largely offsetting the exposures
shown in the above table, does not require
revaluation movements to go to reserves.
Structural foreign exchange exposures
Structural foreign exchange exposures represent net
investments in subsidiaries, branches or associated
undertakings, the functional currencies of which
are currencies other than the US dollar.
Exchange differences on structural exposures
are recorded in the consolidated statement of
recognised income and expense. The main
operating (or functional) currencies in which
HSBC’s business is transacted are the US dollar,
the Hong Kong dollar, sterling, the euro, the
Mexican peso, the Brazilian real and the Chinese
renminbi. As the US dollar and currencies linked to
it form the dominant currency bloc in which
HSBC’s operations transact business, HSBC
Holdings prepares its consolidated financial
statements in US dollars. HSBC’s consolidated
balance sheet is, therefore, affected by exchange
differences between the US dollar and all the non-
US dollar functional currencies of underlying
subsidiaries.
HSBC hedges structural foreign exchange
exposures only in limited circumstances. HSBC’s
structural foreign exchange exposures are managed
with the primary objective of ensuring, where
practical, that HSBC’s consolidated capital ratios,
and the capital ratios of individual banking
subsidiaries, are protected from the effect of
changes in exchange rates. This is usually achieved
by ensuring that, for each subsidiary bank, the ratio
of structural exposures in a given currency to risk-
weighted assets denominated in that currency is
broadly equal to the capital ratio of the subsidiary
in question.
Selective hedges were in place during 2005.
Hedging is undertaken using forward foreign
exchange contracts which are accounted for under
IFRSs as hedges of a net investment in a foreign
operation, or by financing with borrowings in the
same currencies as the functional currencies
involved. There was no ineffectiveness arising from
these hedges in the year ended 31 December 2005.
There was no material effect from exchange
differences on HSBC’s capital ratios during the
period.
HSBC Holdings (Audited IFRS 7 information)
As a financial services holding company, HSBC
Holdings has limited market risk activity. Its
activities predominantly involve maintaining
sufficient capital resources to support the Group’s
diverse activities; allocating these capital resources
across the Group’s businesses; earning dividend
and interest income on its investments in the
Group’s businesses; providing dividend payments
to HSBC Holdings’ equity shareholders and interest
payments to providers of debt capital; and
maintaining a supply of short-term cash resources.
It does not take proprietary trading positions.