HSBC 2005 Annual Report Download - page 160
Download and view the complete annual report
Please find page 160 of the 2005 HSBC annual report below. You can navigate through the pages in the report by either clicking on the pages listed below, or by using the keyword search tool below to find specific information within the annual report.-
 1
1 -
2
-
3
-
4
-
5
-
6
-
7
-
8
-
9
-
10
-
11
-
12
-
13
-
14
-
15
-
16
-
17
-
18
-
19
-
20
-
21
-
22
-
23
-
24
-
25
-
26
-
27
-
28
-
29
-
30
-
31
-
32
-
33
-
34
-
35
-
36
-
37
-
38
-
39
-
40
-
41
-
42
-
43
-
44
-
45
-
46
-
47
-
48
-
49
-
50
-
51
-
52
-
53
-
54
-
55
-
56
-
57
-
58
-
59
-
60
-
61
-
62
-
63
-
64
-
65
-
66
-
67
-
68
-
69
-
70
-
71
-
72
-
73
-
74
-
75
-
76
-
77
-
78
-
79
-
80
-
81
-
82
-
83
-
84
-
85
-
86
-
87
-
88
-
89
-
90
-
91
-
92
-
93
-
94
-
95
-
96
-
97
-
98
-
99
-
100
-
101
-
102
-
103
-
104
-
105
-
106
-
107
-
108
-
109
-
110
-
111
-
112
-
113
-
114
-
115
-
116
-
117
-
118
-
119
-
120
-
121
-
122
-
123
-
124
-
125
-
126
-
127
-
128
-
129
-
130
-
131
-
132
-
133
-
134
-
135
-
136
-
137
-
138
-
139
-
140
-
141
-
142
-
143
-
144
-
145
-
146
-
147
-
148
-
149
-
 150
150 -
 151
151 -
 152
152 -
 153
153 -
 154
154 -
 155
155 -
 156
156 -
 157
157 -
 158
158 -
 159
159 -
 160
160 -
 161
161 -
 162
162 -
 163
163 -
 164
164 -
 165
165 -
 166
166 -
 167
167 -
 168
168 -
 169
169 -
 170
170 -
171
-
172
-
173
-
174
-
175
-
176
-
177
-
178
-
179
-
180
-
181
-
182
-
183
-
184
-
185
-
186
-
187
-
188
-
189
-
190
-
191
-
192
-
193
-
194
-
195
-
196
-
197
-
198
-
199
-
200
-
201
-
202
-
203
-
204
-
205
-
206
-
207
-
208
-
209
-
210
-
211
-
212
-
213
-
214
-
215
-
216
-
217
-
218
-
219
-
220
-
221
-
222
-
223
-
224
-
225
-
226
-
227
-
228
-
229
-
230
-
231
-
232
-
233
-
234
-
235
-
236
-
237
-
238
-
239
-
240
-
241
-
242
-
243
-
244
-
245
-
246
-
247
-
248
-
249
-
250
-
251
-
252
-
253
-
254
-
255
-
256
-
257
-
258
-
259
-
260
-
261
-
262
-
263
-
264
-
265
-
266
-
267
-
268
-
269
-
270
-
271
-
272
-
273
-
274
-
275
-
276
-
277
-
278
-
279
-
280
-
281
-
282
-
283
-
284
-
285
-
286
-
287
-
288
-
289
-
290
-
291
-
292
-
293
-
294
-
295
-
296
-
297
-
298
-
299
-
300
-
301
-
302
-
303
-
304
-
305
-
306
-
307
-
308
-
309
-
310
-
311
-
312
-
313
-
314
-
315
-
316
-
317
-
318
-
319
-
320
-
321
-
322
-
323
-
324
-
325
-
326
-
327
-
328
-
329
-
330
-
331
-
332
-
333
-
334
-
335
-
336
-
337
-
338
-
339
-
340
-
341
-
342
-
343
-
344
-
345
-
346
-
347
-
348
-
349
-
350
-
351
-
352
-
353
-
354
-
355
-
356
-
357
-
358
-
359
-
360
-
361
-
362
-
363
-
364
-
365
-
366
-
367
-
368
-
369
-
370
-
371
-
372
-
373
-
374
-
375
-
376
-
377
-
378
-
379
-
380
-
381
-
382
-
383
-
384
-
385
-
386
-
387
-
388
-
389
-
390
-
391
-
392
-
393
-
394
-
395
-
396
-
397
-
398
-
399
-
400
-
401
-
402
-
403
-
404
-
405
-
406
-
407
-
408
-
409
-
410
-
411
-
412
-
413
-
414
-
415
-
416
-
417
-
418
-
419
-
420
-
421
-
422
-
423
-
424
 |
 |

HSBC HOLDINGS PLC
Financial Review (continued)
158
US dollar
bloc
US$m
Rest of
Americas
bloc
US$m
Hong Kong
dollar
bloc
US$m
Rest of
Asia
bloc
US$m
Sterling
bloc
US$m
Euro
bloc
US$m
Total
US$m
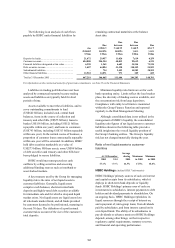
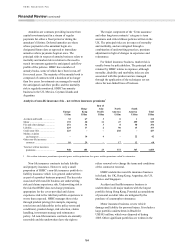
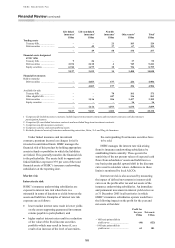
Change in 2006 projected net
interest income
+25 basis points shift in yield curves
at the beginning of each quarter. (448) 74 (18) 28 (47) (114) (525)
-25 basis points shift in yield curves
at the beginning of each quarter. 402 (72) 20 (39) 51 112 474
Change in 2005 projected net
interest income
+25 basis points shift in yield curves
at the beginning of each quarter. (500) 81 2 18 62 (160) (497)
-25 basis points shift in yield curves
at the beginning of each quarter. 637 (83) (104) (13) (70) 157 524
The interest rate sensitivities set out in the table
above are illustrative only and are based on
simplified scenarios. The figures represent the effect
of the pro forma movements in net interest income
based on the projected yield curve scenarios and the
Group’s current interest rate risk profile. This effect,
however, does not incorporate actions that would be
taken by Global Markets or in the business units to
mitigate the impact of this interest rate risk. In
reality, Global Markets seeks proactively to change
the interest rate risk profile to minimise losses and
optimise net revenues. The projections above also
assume that interest rates of all maturities move by
the same amount and, therefore, do not reflect the
potential impact on net interest income of some rates
changing while others remain unchanged. The
projections also make other simplifying assumptions,
including that all positions run to maturity.
The Group’s core exposure to changes in its net
interest income arising from movements in interest
rates falls into three areas: core deposit franchises,
HSBC Finance and Global Markets.
• Core deposit franchises: these are exposed to
changes in the value of the deposits raised and
spreads against wholesale funds; in a low
interest rate environment, the value of core
deposits increases as interest rates rise and
decreases as interest rates fall. This risk is,
however, asymmetrical in a very low interest
rate environment as there is limited room to
lower deposit pricing in the event of interest rate
reductions.
• HSBC Finance provides an offset to the
sensitivity effect of interest rate reductions on
the core deposit franchises. This arises from
having a substantially fixed rate, real estate
secured, lending portfolio funded to an extent
with interest rate sensitive short-term liabilities.
• Global Markets: the residual interest rate risk is
managed within Global Markets. This reflects
the Group’s policy of transferring all interest
rate risk, other than structural risk, to Global
Markets to be managed within defined limits
and with flexibility as to the instruments used.
The major drivers of the changes shown in the
projected effect of interest rate moves in the above
table are set out below.
• In the US dollar bloc, the rise in interest rates in
2005, coupled with an overall flattening of the
yield curve, led the Group to reduce its
sensitivity to falling rates, particularly with
respect to some retail products with embedded
optionality.
• In Hong Kong, the rise in interest rates during
the year improved the sensitivity to falling
interest rates as there was more room to lower
deposit pricing in the event of falling interest
rates.
• Global Markets decreased its exposure to US
dollar, Hong Kong dollar, and euro assets,
contributing to the decreased sensitivity in these
currencies to both rising and falling rates.
It can be seen from the above that projecting the
movement in net interest income from prospective
changes in interest rates is a complex interaction of
structural and managed exposures. In a rising rate
environment, the most critical exposures are those
managed within Global Markets.
Additionally, the Group considers a principal
risk to future net interest income to be a general
flattening of yield curves at a low level of interest
rates, as this reduces the value of the deposit
franchise and limits the opportunities within Global
Markets.