HSBC 2005 Annual Report Download - page 241
Download and view the complete annual report
Please find page 241 of the 2005 HSBC annual report below. You can navigate through the pages in the report by either clicking on the pages listed below, or by using the keyword search tool below to find specific information within the annual report.-
 1
1 -
2
-
3
-
4
-
5
-
6
-
7
-
8
-
9
-
10
-
11
-
12
-
13
-
14
-
15
-
16
-
17
-
18
-
19
-
20
-
21
-
22
-
23
-
24
-
25
-
26
-
27
-
28
-
29
-
30
-
31
-
32
-
33
-
34
-
35
-
36
-
37
-
38
-
39
-
40
-
41
-
42
-
43
-
44
-
45
-
46
-
47
-
48
-
49
-
50
-
51
-
52
-
53
-
54
-
55
-
56
-
57
-
58
-
59
-
60
-
61
-
62
-
63
-
64
-
65
-
66
-
67
-
68
-
69
-
70
-
71
-
72
-
73
-
74
-
75
-
76
-
77
-
78
-
79
-
80
-
81
-
82
-
83
-
84
-
85
-
86
-
87
-
88
-
89
-
90
-
91
-
92
-
93
-
94
-
95
-
96
-
97
-
98
-
99
-
100
-
101
-
102
-
103
-
104
-
105
-
106
-
107
-
108
-
109
-
110
-
111
-
112
-
113
-
114
-
115
-
116
-
117
-
118
-
119
-
120
-
121
-
122
-
123
-
124
-
125
-
126
-
127
-
128
-
129
-
130
-
131
-
132
-
133
-
134
-
135
-
136
-
137
-
138
-
139
-
140
-
141
-
142
-
143
-
144
-
145
-
146
-
147
-
148
-
149
-
150
-
151
-
152
-
153
-
154
-
155
-
156
-
157
-
158
-
159
-
160
-
161
-
162
-
163
-
164
-
165
-
166
-
167
-
168
-
169
-
170
-
171
-
172
-
173
-
174
-
175
-
176
-
177
-
178
-
179
-
180
-
181
-
182
-
183
-
184
-
185
-
186
-
187
-
188
-
189
-
190
-
191
-
192
-
193
-
194
-
195
-
196
-
197
-
198
-
199
-
200
-
201
-
202
-
203
-
204
-
205
-
206
-
207
-
208
-
209
-
210
-
211
-
212
-
213
-
214
-
215
-
216
-
217
-
218
-
219
-
220
-
221
-
222
-
223
-
224
-
225
-
226
-
227
-
228
-
229
-
230
-
 231
231 -
 232
232 -
 233
233 -
 234
234 -
 235
235 -
 236
236 -
 237
237 -
 238
238 -
 239
239 -
 240
240 -
 241
241 -
 242
242 -
 243
243 -
 244
244 -
 245
245 -
 246
246 -
 247
247 -
 248
248 -
 249
249 -
 250
250 -
 251
251 -
252
-
253
-
254
-
255
-
256
-
257
-
258
-
259
-
260
-
261
-
262
-
263
-
264
-
265
-
266
-
267
-
268
-
269
-
270
-
271
-
272
-
273
-
274
-
275
-
276
-
277
-
278
-
279
-
280
-
281
-
282
-
283
-
284
-
285
-
286
-
287
-
288
-
289
-
290
-
291
-
292
-
293
-
294
-
295
-
296
-
297
-
298
-
299
-
300
-
301
-
302
-
303
-
304
-
305
-
306
-
307
-
308
-
309
-
310
-
311
-
312
-
313
-
314
-
315
-
316
-
317
-
318
-
319
-
320
-
321
-
322
-
323
-
324
-
325
-
326
-
327
-
328
-
329
-
330
-
331
-
332
-
333
-
334
-
335
-
336
-
337
-
338
-
339
-
340
-
341
-
342
-
343
-
344
-
345
-
346
-
347
-
348
-
349
-
350
-
351
-
352
-
353
-
354
-
355
-
356
-
357
-
358
-
359
-
360
-
361
-
362
-
363
-
364
-
365
-
366
-
367
-
368
-
369
-
370
-
371
-
372
-
373
-
374
-
375
-
376
-
377
-
378
-
379
-
380
-
381
-
382
-
383
-
384
-
385
-
386
-
387
-
388
-
389
-
390
-
391
-
392
-
393
-
394
-
395
-
396
-
397
-
398
-
399
-
400
-
401
-
402
-
403
-
404
-
405
-
406
-
407
-
408
-
409
-
410
-
411
-
412
-
413
-
414
-
415
-
416
-
417
-
418
-
419
-
420
-
421
-
422
-
423
-
424
 |
 |

239
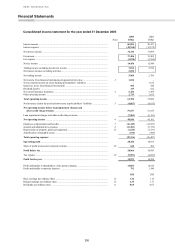
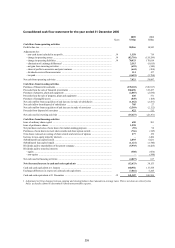
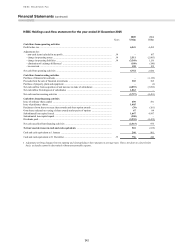
Consolidated cash flow statement for the year ended 31 December 2005
2005 2004
Notes US$m US$m
Cash flows from operating activities
Profit before tax ........................................................................................................................ 20,966 18,943
Adjustments for:
– non-cash items included in net profit ................................................................................. 39 1,358 719
– change in operating assets ................................................................................................. 39 (82,710) (124,299)
– change in operating liabilities ............................................................................................ 39 70,933 178,014
– elimination of exchange differences1 ................................................................................. 2,315 (9,015)
– net gain from investing activities ....................................................................................... (692) (540)
– share of profits in associates and joint ventures ................................................................. (644) (268)
– dividends received from associates ................................................................................... 114 127
– tax paid .............................................................................................................................. (4,619) (3,784)
Net cash from operating activities ............................................................................................ 7,021 59,897
Cash flows from investing activities
Purchase of financial investments ............................................................................................. (378,103) (330,917)
Proceeds from the sale of financial investments ....................................................................... 368,696 315,437
Purchase of property, plant and equipment ............................................................................... (2,887) (2,830)
Proceeds from the sale of property, plant and equipment ......................................................... 620 371
Purchase of intangible assets .................................................................................................... (849) (108)
Net cash outflow from acquisition of and increase in stake of subsidiaries .............................. (1,662) (2,431)
Net cash inflow from disposal of subsidiaries .......................................................................... 705 27
Net cash outflow from acquisition of and increase in stake of associates ................................. (2,569) (2,122)
Proceeds from disposal of associates ........................................................................................ 422 212
Net cash used in investing activities ......................................................................................... (15,627) (22,361)
Cash flows from financing activities
Issue of ordinary share capital .................................................................................................. 690 581
Issue of preference shares ......................................................................................................... 1,298 –
Net purchases and sales of own shares for market-making purposes ........................................ (55) 98
Purchases of own shares to meet share awards and share option awards .................................. (766) (345)
Own shares released on vesting of share awards and exercise of options ................................. 277 159
Increase in non-equity minority interests .................................................................................. –1,480
Subordinated loan capital issued ...............................................................................................2,093 6,021
Subordinated loan capital repaid ...............................................................................................(1,121) (1,740)
Dividends paid to shareholders of the parent company ............................................................. (5,935) (4,425)
Dividends paid to minority interests:
– equity ................................................................................................................................. (508) (664)
– non-equity ......................................................................................................................... –(548)
Net cash used in financing activities ......................................................................................... (4,027) 617
Net (decrease)/increase in cash and cash equivalents .......................................................... (12,633) 38,153
Cash and cash equivalents at 1 January .................................................................................... 160,956 117,558
Exchange differences in respect of cash and cash equivalents .................................................. (7,016) 5,245
Cash and cash equivalents at 31 December .............................................................................. 39 141,307 160,956
1Adjustment to bring changes between opening and closing balance sheet amounts to average rates. This is not done on a line-by-line
basis, as details cannot be determined without unreasonable expense.