HSBC 2005 Annual Report Download - page 66
Download and view the complete annual report
Please find page 66 of the 2005 HSBC annual report below. You can navigate through the pages in the report by either clicking on the pages listed below, or by using the keyword search tool below to find specific information within the annual report.-
 1
1 -
2
-
3
-
4
-
5
-
6
-
7
-
8
-
9
-
10
-
11
-
12
-
13
-
14
-
15
-
16
-
17
-
18
-
19
-
20
-
21
-
22
-
23
-
24
-
25
-
26
-
27
-
28
-
29
-
30
-
31
-
32
-
33
-
34
-
35
-
36
-
37
-
38
-
39
-
40
-
41
-
42
-
43
-
44
-
45
-
46
-
47
-
48
-
49
-
50
-
51
-
52
-
53
-
54
-
55
-
 56
56 -
 57
57 -
 58
58 -
 59
59 -
 60
60 -
 61
61 -
 62
62 -
 63
63 -
 64
64 -
 65
65 -
 66
66 -
 67
67 -
 68
68 -
 69
69 -
 70
70 -
 71
71 -
 72
72 -
 73
73 -
 74
74 -
 75
75 -
 76
76 -
77
-
78
-
79
-
80
-
81
-
82
-
83
-
84
-
85
-
86
-
87
-
88
-
89
-
90
-
91
-
92
-
93
-
94
-
95
-
96
-
97
-
98
-
99
-
100
-
101
-
102
-
103
-
104
-
105
-
106
-
107
-
108
-
109
-
110
-
111
-
112
-
113
-
114
-
115
-
116
-
117
-
118
-
119
-
120
-
121
-
122
-
123
-
124
-
125
-
126
-
127
-
128
-
129
-
130
-
131
-
132
-
133
-
134
-
135
-
136
-
137
-
138
-
139
-
140
-
141
-
142
-
143
-
144
-
145
-
146
-
147
-
148
-
149
-
150
-
151
-
152
-
153
-
154
-
155
-
156
-
157
-
158
-
159
-
160
-
161
-
162
-
163
-
164
-
165
-
166
-
167
-
168
-
169
-
170
-
171
-
172
-
173
-
174
-
175
-
176
-
177
-
178
-
179
-
180
-
181
-
182
-
183
-
184
-
185
-
186
-
187
-
188
-
189
-
190
-
191
-
192
-
193
-
194
-
195
-
196
-
197
-
198
-
199
-
200
-
201
-
202
-
203
-
204
-
205
-
206
-
207
-
208
-
209
-
210
-
211
-
212
-
213
-
214
-
215
-
216
-
217
-
218
-
219
-
220
-
221
-
222
-
223
-
224
-
225
-
226
-
227
-
228
-
229
-
230
-
231
-
232
-
233
-
234
-
235
-
236
-
237
-
238
-
239
-
240
-
241
-
242
-
243
-
244
-
245
-
246
-
247
-
248
-
249
-
250
-
251
-
252
-
253
-
254
-
255
-
256
-
257
-
258
-
259
-
260
-
261
-
262
-
263
-
264
-
265
-
266
-
267
-
268
-
269
-
270
-
271
-
272
-
273
-
274
-
275
-
276
-
277
-
278
-
279
-
280
-
281
-
282
-
283
-
284
-
285
-
286
-
287
-
288
-
289
-
290
-
291
-
292
-
293
-
294
-
295
-
296
-
297
-
298
-
299
-
300
-
301
-
302
-
303
-
304
-
305
-
306
-
307
-
308
-
309
-
310
-
311
-
312
-
313
-
314
-
315
-
316
-
317
-
318
-
319
-
320
-
321
-
322
-
323
-
324
-
325
-
326
-
327
-
328
-
329
-
330
-
331
-
332
-
333
-
334
-
335
-
336
-
337
-
338
-
339
-
340
-
341
-
342
-
343
-
344
-
345
-
346
-
347
-
348
-
349
-
350
-
351
-
352
-
353
-
354
-
355
-
356
-
357
-
358
-
359
-
360
-
361
-
362
-
363
-
364
-
365
-
366
-
367
-
368
-
369
-
370
-
371
-
372
-
373
-
374
-
375
-
376
-
377
-
378
-
379
-
380
-
381
-
382
-
383
-
384
-
385
-
386
-
387
-
388
-
389
-
390
-
391
-
392
-
393
-
394
-
395
-
396
-
397
-
398
-
399
-
400
-
401
-
402
-
403
-
404
-
405
-
406
-
407
-
408
-
409
-
410
-
411
-
412
-
413
-
414
-
415
-
416
-
417
-
418
-
419
-
420
-
421
-
422
-
423
-
424
 |
 |

HSBC HOLDINGS PLC
Financial Review (continued)
64
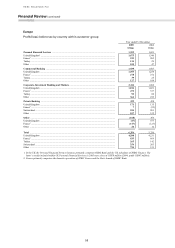
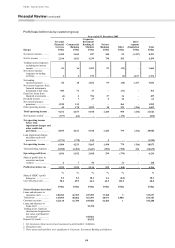
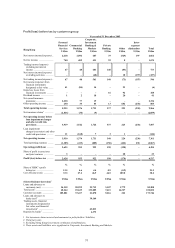
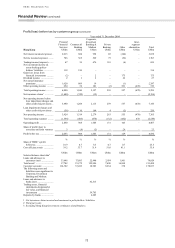
Profit/(loss) before tax by customer group
Year ended 31 December 2005
Europe
Personal
Financial
Services
US$m
Commercial
Banking
US$m
Corporate,
Investment
Banking &
Markets
US$m
Private
Banking
US$m
Other
US$m
Inter-
segment
elimination
US$m
Total
US$m
Net interest income ........... 5,309 2,659 827 548 95 (1,217) 8,221
Net fee income ................. 2,314 1,621 1,339 730 295 – 6,299
Trading income/(expense)
excluding net interest
income .......................... 81 16 1,493 93 (23) – 1,660
Net interest income/
(expense) on trading
activities ....................... 3 2 159 – (5) 1,217 1,376
Net trading
income/(expense) ......... 84 18 1,652 93 (28) 1,217 3,036
Net income/(expense) from
financial instruments
designated at fair value . 305 71 17 – (31) – 362
Gains less losses from
financial investments .... (4) 4 396 27 16 – 439
Dividend income .............. 2 7 27 9 18 – 63
Net earned insurance
premiums ...................... 1,220 115 – – 264 – 1,599
Other operating income .... 42 178 1,252 18 329 (216) 1,603
Total operating income .. 9,272 4,673 5,510 1,425 958 (216) 21,622
Net insurance claims1 ....... (577) (62) – – (179) – (818)
Net operating income
before loan
impairment charges and
other credit risk
provisions .................... 8,695 4,611 5,510 1,425 779 (216) 20,804
Loan impairment charges
and other credit risk
provisions ..................... (1,711) (378) 155 5 – – (1,929)
Net operating income ..... 6,984 4,233 5,665 1,430 779 (216) 18,875
Total operating expenses .. (5,058) (2,301) (3,647) (891) (958) 216 (12,639)
Operating profit/(loss) .... 1,926 1,932 2,018 539 (179) – 6,236
Share of profit/(loss) in
associates and joint
ventures ........................ 6 7 96 – 11 – 120
Profit/(loss) before tax .... 1,932 1,939 2,114 539 (168) – 6,356
%%%%% %
Share of HSBC’s profit
before tax ..................... 9.2 9.2 10.1 2.6 (0.8) 30.3
Cost efficiency ratio .......... 58.2 49.9 66.2 62.5 122.9 60.8
US$m US$m US$m US$m US$m US$m
Selected balance sheet data2
Loans and advances to
customers (net) ............. 120,302 66,965 107,899 17,368 3 312,537
Total assets ....................... 143,095 80,864 367,893 40,971 3,880 636,703
Customer accounts ........... 122,118 61,789 109,086 41,206 1 334,200
Loans and advances to
banks (net)3 .................. 34,218
Trading assets, financial
instruments designated at
fair value, and financial
investments3 ................. 168,062
Deposits by banks3 ............ 45,075
1Net insurance claims incurred and movement in policyholders’ liabilities.
2Third party only.
3These assets and liabilities were significant to Corporate, Investment Banking and Markets.