HSBC 2005 Annual Report Download - page 141
Download and view the complete annual report
Please find page 141 of the 2005 HSBC annual report below. You can navigate through the pages in the report by either clicking on the pages listed below, or by using the keyword search tool below to find specific information within the annual report.-
 1
1 -
2
-
3
-
4
-
5
-
6
-
7
-
8
-
9
-
10
-
11
-
12
-
13
-
14
-
15
-
16
-
17
-
18
-
19
-
20
-
21
-
22
-
23
-
24
-
25
-
26
-
27
-
28
-
29
-
30
-
31
-
32
-
33
-
34
-
35
-
36
-
37
-
38
-
39
-
40
-
41
-
42
-
43
-
44
-
45
-
46
-
47
-
48
-
49
-
50
-
51
-
52
-
53
-
54
-
55
-
56
-
57
-
58
-
59
-
60
-
61
-
62
-
63
-
64
-
65
-
66
-
67
-
68
-
69
-
70
-
71
-
72
-
73
-
74
-
75
-
76
-
77
-
78
-
79
-
80
-
81
-
82
-
83
-
84
-
85
-
86
-
87
-
88
-
89
-
90
-
91
-
92
-
93
-
94
-
95
-
96
-
97
-
98
-
99
-
100
-
101
-
102
-
103
-
104
-
105
-
106
-
107
-
108
-
109
-
110
-
111
-
112
-
113
-
114
-
115
-
116
-
117
-
118
-
119
-
120
-
121
-
122
-
123
-
124
-
125
-
126
-
127
-
128
-
129
-
130
-
 131
131 -
 132
132 -
 133
133 -
 134
134 -
 135
135 -
 136
136 -
 137
137 -
 138
138 -
 139
139 -
 140
140 -
 141
141 -
 142
142 -
 143
143 -
 144
144 -
 145
145 -
 146
146 -
 147
147 -
 148
148 -
 149
149 -
 150
150 -
 151
151 -
152
-
153
-
154
-
155
-
156
-
157
-
158
-
159
-
160
-
161
-
162
-
163
-
164
-
165
-
166
-
167
-
168
-
169
-
170
-
171
-
172
-
173
-
174
-
175
-
176
-
177
-
178
-
179
-
180
-
181
-
182
-
183
-
184
-
185
-
186
-
187
-
188
-
189
-
190
-
191
-
192
-
193
-
194
-
195
-
196
-
197
-
198
-
199
-
200
-
201
-
202
-
203
-
204
-
205
-
206
-
207
-
208
-
209
-
210
-
211
-
212
-
213
-
214
-
215
-
216
-
217
-
218
-
219
-
220
-
221
-
222
-
223
-
224
-
225
-
226
-
227
-
228
-
229
-
230
-
231
-
232
-
233
-
234
-
235
-
236
-
237
-
238
-
239
-
240
-
241
-
242
-
243
-
244
-
245
-
246
-
247
-
248
-
249
-
250
-
251
-
252
-
253
-
254
-
255
-
256
-
257
-
258
-
259
-
260
-
261
-
262
-
263
-
264
-
265
-
266
-
267
-
268
-
269
-
270
-
271
-
272
-
273
-
274
-
275
-
276
-
277
-
278
-
279
-
280
-
281
-
282
-
283
-
284
-
285
-
286
-
287
-
288
-
289
-
290
-
291
-
292
-
293
-
294
-
295
-
296
-
297
-
298
-
299
-
300
-
301
-
302
-
303
-
304
-
305
-
306
-
307
-
308
-
309
-
310
-
311
-
312
-
313
-
314
-
315
-
316
-
317
-
318
-
319
-
320
-
321
-
322
-
323
-
324
-
325
-
326
-
327
-
328
-
329
-
330
-
331
-
332
-
333
-
334
-
335
-
336
-
337
-
338
-
339
-
340
-
341
-
342
-
343
-
344
-
345
-
346
-
347
-
348
-
349
-
350
-
351
-
352
-
353
-
354
-
355
-
356
-
357
-
358
-
359
-
360
-
361
-
362
-
363
-
364
-
365
-
366
-
367
-
368
-
369
-
370
-
371
-
372
-
373
-
374
-
375
-
376
-
377
-
378
-
379
-
380
-
381
-
382
-
383
-
384
-
385
-
386
-
387
-
388
-
389
-
390
-
391
-
392
-
393
-
394
-
395
-
396
-
397
-
398
-
399
-
400
-
401
-
402
-
403
-
404
-
405
-
406
-
407
-
408
-
409
-
410
-
411
-
412
-
413
-
414
-
415
-
416
-
417
-
418
-
419
-
420
-
421
-
422
-
423
-
424
 |
 |

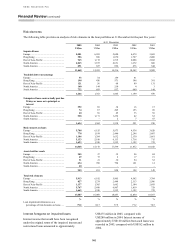
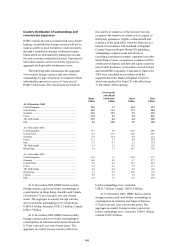
139
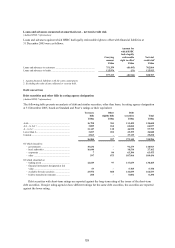
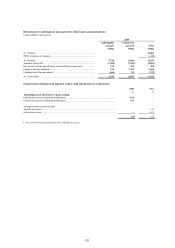
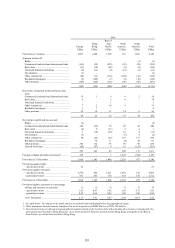
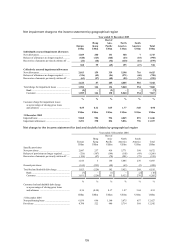
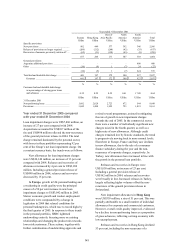
Net impairment charge to the income statement by geographical region
Year ended 31 December 2005
Europe
US$m
Hong
Kong
US$m
Rest of
Asia-
Pacific
US$m
North
America
US$m
South
America
US$m
Total
US$m
Individually assessed impairment allowances
New allowances .................................................. 1,029 200 131 348 7 1,715
Release of allowances no longer required ........... (648) (123) (166) (43) (18) (998)
Recoveries of amounts previously written off .... (21) (18) (34) (110) (16) (199)
360 59 (69) 195 (27) 518
Collectively assessed impairment allowances
New allowances .................................................. 2,013 159 339 5,198 716 8,425
Release of allowances no longer required ........... (326) (45) (86) (271) (60) (788)
Recoveries of amounts previously written off .... (63) (27) (48) (82) (75) (295)
1,624 87 205 4,845 581 7,342
Total charge for impairment losses ..................... 1,984 146 136 5,040 554 7,860
Bank .............................................................. (5) – (2) – – (7)
Customer ....................................................... 1,989 146 138 5,040 554 7,867
%%%%%%
Customer charge for impairment losses
as a percentage of closing gross loans
and advances ................................................. 0.55 0.12 0.15 1.77 3.60 0.90
US$m US$m US$m US$m US$m US$m
31 December 2005
Impaired loans .................................................... 5,068 506 936 4,045 891 11,446
Impairment allowances ....................................... 3,491 398 836 5,836 796 11,357
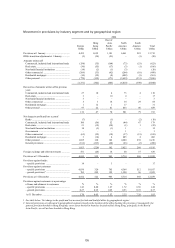
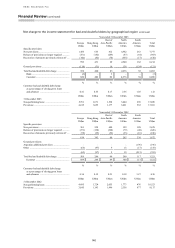
Net charge to the income statement for bad and doubtful debts by geographical region
Year ended 31 December 2004
Europe
US$m
Hong
Kong
US$m
Rest of
Asia-
Pacific
US$m
North
America
US$m
South
America
US$m
Total
US$m
Specific provisions
New provisions ................................................... 2,047 237 419 5,771 398 8,872
Release of provisions no longer required ............ (726) (187) (199) (105) (49) (1,266)
Recoveries of amounts previously written off .... (136) (47) (70) (581) (79) (913)
1,185 3 150 5,085 270 6,693
General provisions (162) (223) (48) (63) (2) (498)
Total bad and doubtful debt charge .................... 1,023 (220) 102 5,022 268 6,195
Bank .............................................................. (7) – (1) – (2) (10)
Customer ....................................................... 1,031 (220) 103 5,022 270 6,205
%%%%%%
Customer bad and doubtful debt charge
as a percentage of closing gross loans
and advances ................................................. 0.36 (0.28) 0.17 1.97 3.44 0.91
US$m US$m US$m US$m US$m US$m
31 December 2004
Non-performing loans ........................................ 6,039 696 1,160 3,875 657 12,427
Provisions ........................................................... 4,798 522 940 5,714 568 12,542