HSBC 2005 Annual Report Download - page 56
Download and view the complete annual report
Please find page 56 of the 2005 HSBC annual report below. You can navigate through the pages in the report by either clicking on the pages listed below, or by using the keyword search tool below to find specific information within the annual report.-
 1
1 -
2
-
3
-
4
-
5
-
6
-
7
-
8
-
9
-
10
-
11
-
12
-
13
-
14
-
15
-
16
-
17
-
18
-
19
-
20
-
21
-
22
-
23
-
24
-
25
-
26
-
27
-
28
-
29
-
30
-
31
-
32
-
33
-
34
-
35
-
36
-
37
-
38
-
39
-
40
-
41
-
42
-
43
-
44
-
45
-
 46
46 -
 47
47 -
 48
48 -
 49
49 -
 50
50 -
 51
51 -
 52
52 -
 53
53 -
 54
54 -
 55
55 -
 56
56 -
 57
57 -
 58
58 -
 59
59 -
 60
60 -
 61
61 -
 62
62 -
 63
63 -
 64
64 -
 65
65 -
 66
66 -
67
-
68
-
69
-
70
-
71
-
72
-
73
-
74
-
75
-
76
-
77
-
78
-
79
-
80
-
81
-
82
-
83
-
84
-
85
-
86
-
87
-
88
-
89
-
90
-
91
-
92
-
93
-
94
-
95
-
96
-
97
-
98
-
99
-
100
-
101
-
102
-
103
-
104
-
105
-
106
-
107
-
108
-
109
-
110
-
111
-
112
-
113
-
114
-
115
-
116
-
117
-
118
-
119
-
120
-
121
-
122
-
123
-
124
-
125
-
126
-
127
-
128
-
129
-
130
-
131
-
132
-
133
-
134
-
135
-
136
-
137
-
138
-
139
-
140
-
141
-
142
-
143
-
144
-
145
-
146
-
147
-
148
-
149
-
150
-
151
-
152
-
153
-
154
-
155
-
156
-
157
-
158
-
159
-
160
-
161
-
162
-
163
-
164
-
165
-
166
-
167
-
168
-
169
-
170
-
171
-
172
-
173
-
174
-
175
-
176
-
177
-
178
-
179
-
180
-
181
-
182
-
183
-
184
-
185
-
186
-
187
-
188
-
189
-
190
-
191
-
192
-
193
-
194
-
195
-
196
-
197
-
198
-
199
-
200
-
201
-
202
-
203
-
204
-
205
-
206
-
207
-
208
-
209
-
210
-
211
-
212
-
213
-
214
-
215
-
216
-
217
-
218
-
219
-
220
-
221
-
222
-
223
-
224
-
225
-
226
-
227
-
228
-
229
-
230
-
231
-
232
-
233
-
234
-
235
-
236
-
237
-
238
-
239
-
240
-
241
-
242
-
243
-
244
-
245
-
246
-
247
-
248
-
249
-
250
-
251
-
252
-
253
-
254
-
255
-
256
-
257
-
258
-
259
-
260
-
261
-
262
-
263
-
264
-
265
-
266
-
267
-
268
-
269
-
270
-
271
-
272
-
273
-
274
-
275
-
276
-
277
-
278
-
279
-
280
-
281
-
282
-
283
-
284
-
285
-
286
-
287
-
288
-
289
-
290
-
291
-
292
-
293
-
294
-
295
-
296
-
297
-
298
-
299
-
300
-
301
-
302
-
303
-
304
-
305
-
306
-
307
-
308
-
309
-
310
-
311
-
312
-
313
-
314
-
315
-
316
-
317
-
318
-
319
-
320
-
321
-
322
-
323
-
324
-
325
-
326
-
327
-
328
-
329
-
330
-
331
-
332
-
333
-
334
-
335
-
336
-
337
-
338
-
339
-
340
-
341
-
342
-
343
-
344
-
345
-
346
-
347
-
348
-
349
-
350
-
351
-
352
-
353
-
354
-
355
-
356
-
357
-
358
-
359
-
360
-
361
-
362
-
363
-
364
-
365
-
366
-
367
-
368
-
369
-
370
-
371
-
372
-
373
-
374
-
375
-
376
-
377
-
378
-
379
-
380
-
381
-
382
-
383
-
384
-
385
-
386
-
387
-
388
-
389
-
390
-
391
-
392
-
393
-
394
-
395
-
396
-
397
-
398
-
399
-
400
-
401
-
402
-
403
-
404
-
405
-
406
-
407
-
408
-
409
-
410
-
411
-
412
-
413
-
414
-
415
-
416
-
417
-
418
-
419
-
420
-
421
-
422
-
423
-
424
 |
 |

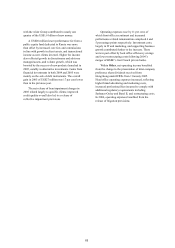
HSBC HOLDINGS PLC
Financial Review (continued)
54
Other6
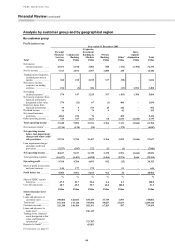
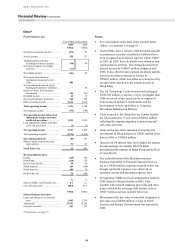
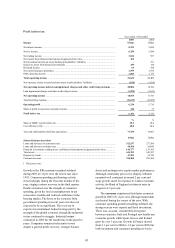
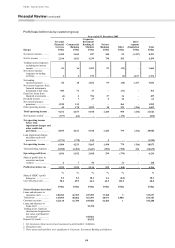
Profit before tax Notes
Year ended 31 December
2005 2004
US$m US$m
Net interest (expense)/income ............ (472) 90
Net fee income ................................... 220 171
Trading (expense)/income
excluding net interest income ......... (90) 40
Net interest expense on trading
activities ......................................... (13) –
Net trading income1 ............................ (103) 40
Net income from financial
instruments designated at fair
value ............................................... 406 –
Net investment income on assets
backing policyholders’ liabilities .... –44
Gains less losses from financial
investments .................................... 144 219
Dividend income ................................ 42 16
Net earned insurance premiums .......... 260 558
Other operating income ...................... 2,634 2,050
Total operating income .................... 3,131 3,188
Net insurance claims2 ......................... (179) (359)
Net operating income before loan
impairment charges and other
credit risk provisions .................... 2,952 2,829
Loan impairment charges and other
credit risk provisions ...................... (1) (1)
Net operating income ....................... 2,951 2,828
Total operating expenses .................... (2,976) (2,493)
Operating profit/(loss)....................... (25) 335
Share of profit in associates and
joint ventures .................................. 51 69
Profit before tax ................................ 26 404
By geographical region
Europe ................................................ (168) 366
Hong Kong ......................................... (178) 129
Rest of Asia-Pacific ............................ 94 26
North America .................................... 169 (196)
South America .................................... 109 79
Profit before tax .................................. 26 404
%%
Share of HSBC’s profit before tax ...... 0.1 2.1
Cost efficiency ratio ........................... 100.8 88.1
US$m US$m
Selected balance sheet data3
Loans and advances to customers
(net) ................................................ 1,893 2,339
Total assets4 ........................................ 27,653 26,201
Customer accounts ............................. 507 557
For footnotes, see page 55.
• For a description of the main items reported under
‘Other’, see footnote 6 on page 55.
• Under IFRSs, from 1 January 2005 dividends payable
on preference securities classified as liabilities have
been recognised as an interest expense within ‘Other’
in 2005. In 2004, these dividends were shown as non-
equity minority interests. This change decreased net
interest income by US$653 million compared with
2004. It also affected inter-regional dividends and this
increased net interest income in Europe by
US$387 million, which was offset at a Group level by
an equivalent reduction in net interest income in
Hong Kong.
• The US Technology Centre incurred and recharged
US$1,100 million of expense, 18 per cent higher than
2004 as a result of increased activity in support of
both increased global IT requirements and the
development of new capabilities in Corporate,
Investment Banking and Markets.
• Costs incurred in the Group Service Centres outside
the US increased by 75 per cent to US$302 million,
reflecting the ongoing migration of processing and
call centre activities.
• Gains on the sale and revaluation of property and
investments in Hong Kong were US$65 million lower
than in 2004, at US$263 million.
• Increases in US interest rates led to higher net interest
income earnings on centrally held US dollar
denominated investments in Hong Kong and the Rest
of Asia-Pacific.
• The reclassification of the Brazilian insurance
business from Other to Personal Financial Services
led to a US$16 million reduction in profit before tax,
though significant variances were observed on
operating income and operating expenses lines.
• In Argentina, HSBC received compensation bonds in
2005 related to the pesification in 2002. This,
together with reduced Amparos provisions and other
items related to the sovereign debt default, led to a
US$17 million increase in profit before tax.
• Movement in the fair value of own debt designated at
fair value was US$386 million, arising in North
America and Europe. No movement was reported in
2004.