HSBC 2005 Annual Report Download - page 342
Download and view the complete annual report
Please find page 342 of the 2005 HSBC annual report below. You can navigate through the pages in the report by either clicking on the pages listed below, or by using the keyword search tool below to find specific information within the annual report.-
 1
1 -
2
-
3
-
4
-
5
-
6
-
7
-
8
-
9
-
10
-
11
-
12
-
13
-
14
-
15
-
16
-
17
-
18
-
19
-
20
-
21
-
22
-
23
-
24
-
25
-
26
-
27
-
28
-
29
-
30
-
31
-
32
-
33
-
34
-
35
-
36
-
37
-
38
-
39
-
40
-
41
-
42
-
43
-
44
-
45
-
46
-
47
-
48
-
49
-
50
-
51
-
52
-
53
-
54
-
55
-
56
-
57
-
58
-
59
-
60
-
61
-
62
-
63
-
64
-
65
-
66
-
67
-
68
-
69
-
70
-
71
-
72
-
73
-
74
-
75
-
76
-
77
-
78
-
79
-
80
-
81
-
82
-
83
-
84
-
85
-
86
-
87
-
88
-
89
-
90
-
91
-
92
-
93
-
94
-
95
-
96
-
97
-
98
-
99
-
100
-
101
-
102
-
103
-
104
-
105
-
106
-
107
-
108
-
109
-
110
-
111
-
112
-
113
-
114
-
115
-
116
-
117
-
118
-
119
-
120
-
121
-
122
-
123
-
124
-
125
-
126
-
127
-
128
-
129
-
130
-
131
-
132
-
133
-
134
-
135
-
136
-
137
-
138
-
139
-
140
-
141
-
142
-
143
-
144
-
145
-
146
-
147
-
148
-
149
-
150
-
151
-
152
-
153
-
154
-
155
-
156
-
157
-
158
-
159
-
160
-
161
-
162
-
163
-
164
-
165
-
166
-
167
-
168
-
169
-
170
-
171
-
172
-
173
-
174
-
175
-
176
-
177
-
178
-
179
-
180
-
181
-
182
-
183
-
184
-
185
-
186
-
187
-
188
-
189
-
190
-
191
-
192
-
193
-
194
-
195
-
196
-
197
-
198
-
199
-
200
-
201
-
202
-
203
-
204
-
205
-
206
-
207
-
208
-
209
-
210
-
211
-
212
-
213
-
214
-
215
-
216
-
217
-
218
-
219
-
220
-
221
-
222
-
223
-
224
-
225
-
226
-
227
-
228
-
229
-
230
-
231
-
232
-
233
-
234
-
235
-
236
-
237
-
238
-
239
-
240
-
241
-
242
-
243
-
244
-
245
-
246
-
247
-
248
-
249
-
250
-
251
-
252
-
253
-
254
-
255
-
256
-
257
-
258
-
259
-
260
-
261
-
262
-
263
-
264
-
265
-
266
-
267
-
268
-
269
-
270
-
271
-
272
-
273
-
274
-
275
-
276
-
277
-
278
-
279
-
280
-
281
-
282
-
283
-
284
-
285
-
286
-
287
-
288
-
289
-
290
-
291
-
292
-
293
-
294
-
295
-
296
-
297
-
298
-
299
-
300
-
301
-
302
-
303
-
304
-
305
-
306
-
307
-
308
-
309
-
310
-
311
-
312
-
313
-
314
-
315
-
316
-
317
-
318
-
319
-
320
-
321
-
322
-
323
-
324
-
325
-
326
-
327
-
328
-
329
-
330
-
331
-
 332
332 -
 333
333 -
 334
334 -
 335
335 -
 336
336 -
 337
337 -
 338
338 -
 339
339 -
 340
340 -
 341
341 -
 342
342 -
 343
343 -
 344
344 -
 345
345 -
 346
346 -
 347
347 -
 348
348 -
 349
349 -
 350
350 -
 351
351 -
 352
352 -
353
-
354
-
355
-
356
-
357
-
358
-
359
-
360
-
361
-
362
-
363
-
364
-
365
-
366
-
367
-
368
-
369
-
370
-
371
-
372
-
373
-
374
-
375
-
376
-
377
-
378
-
379
-
380
-
381
-
382
-
383
-
384
-
385
-
386
-
387
-
388
-
389
-
390
-
391
-
392
-
393
-
394
-
395
-
396
-
397
-
398
-
399
-
400
-
401
-
402
-
403
-
404
-
405
-
406
-
407
-
408
-
409
-
410
-
411
-
412
-
413
-
414
-
415
-
416
-
417
-
418
-
419
-
420
-
421
-
422
-
423
-
424
 |
 |

HSBC HOLDINGS PLC
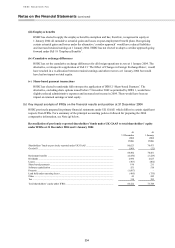
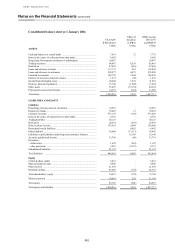
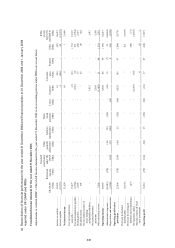
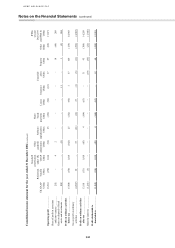
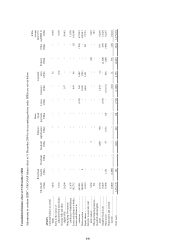
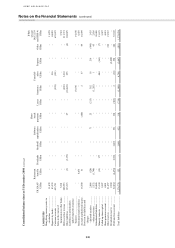
Notes on the Financial Statements (continued)
340
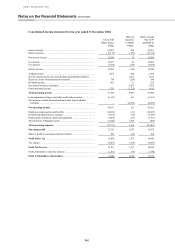
Consolidated income statement for the year ended 31 December 2004
UK GAAP
IFRSs format
Effect of
transition
to IFRSs
IFRSs (except
IAS 32/39
and IFRS 4)
US$m US$m US$m
Interest income ..................................................................................... 50,203 268 50,471
Interest expense .................................................................................... (19,179) (193) (19,372)
Net interest income .............................................................................. 31,024 75 31,099
Fee income ........................................................................................... 15,877 25 15,902
Fee expense .......................................................................................... (2,784) (170) (2,954)
Net fee income ..................................................................................... 13,093 (145) 12,948
Trading income .................................................................................... 2,566 220 2,786
Net investment income on assets backing policyholder liabilities ........ – 1,012 1,012
Gains less losses from financial investments ........................................ 770 (230) 540
Dividend income .................................................................................. 601 21 622
Net earned insurance premiums ........................................................... – 5,368 5,368
Other operating income ........................................................................ 3,335 (1,722) 1,613
Total operating income ...................................................................... 51,389 4,599 55,988
Loan impairment charges and other credit risk provisions ................... (6,352) 161 (6,191)
Net insurance claims incurred and movement in policyholder
liabilities ........................................................................................... – (4,635) (4,635)
Net operating income ......................................................................... 45,037 125 45,162
Employee compensation and benefits .................................................. (14,492) (31) (14,523)
General and administrative expenses .................................................... (9,723) (16) (9,739)
Depreciation of property, plant and equipment .................................... (1,664) (67) (1,731)
Amortisation of intangible assets ......................................................... (1,842) 1,348 (494)
Total operating expenses ................................................................... (27,721) 1,234 (26,487)
Operating profit .................................................................................. 17,316 1,359 18,675
Share of profit in associates and joint ventures ..................................... 292 (24) 268
Profit before tax ................................................................................. 17,608 1,335 18,943
Tax expense ......................................................................................... (4,507) (178) (4,685)
Profit for the year ............................................................................... 13,101 1,157 14,258
Profit attributable to minority interests ................................................. (1,261) (79) (1,340)
Profit attributable to shareholders ................................................... 11,840 1,078 12,918